Story City: Fire Incidents, Iowa (IA)
Where are fire incidents reported in Story City, IA
Something went wrong! Please refresh the page.
|
| |||||||||||||||||||||||||||||||||||||||||||||||||||||||||||||||||||||||||||||||||||||||||||||||||||||||||||||
2002 - 2017 National Fire Incident Reporting System (NFIRS) incidents
- Incident types reported to NFIRS in Story City, IA
- 31640.3%Fire
- 15920.3%Hazardous Condition
- 11614.8%Rescue & EMS
- 8711.1%False Alarm
- 587.4%Good Intent Call
- 364.6%Service Call
- 70.9%Severe Weather
- 60.8%Overpressure Rupture
- Fire incident types reported to NFIRS in Story City, IA
- 15950.3%Outside Fires
- 8827.8%Structure Fires
- 5015.8%Mobile Property/Vehicle Fires
- 196.0%Other
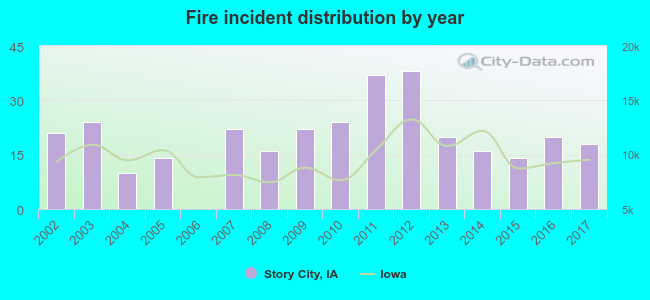 According to the data from the years 2002 - 2017 the average number of fires per year is 20. The highest number of fires - 38 took place in 2012, and the least - 0 in 2006. The data has a dropping trend.
 28.2% incidents where reported in the morning and 71.8% in the evening. The most fires (20.6%) took place on Saturday, and the least (10.1%) on Sunday.
 Based on the 316 incident reports from years 2002 - 2017 most fires (12.7%) took place during October, and the least (3.5%) in February.
 Out of all 785 cases reported during the years 2002 - 2017, the most belonged to the categories: Fire (40.3%), Hazardous Condition (20.3%), and Rescue & EMS (14.8%).
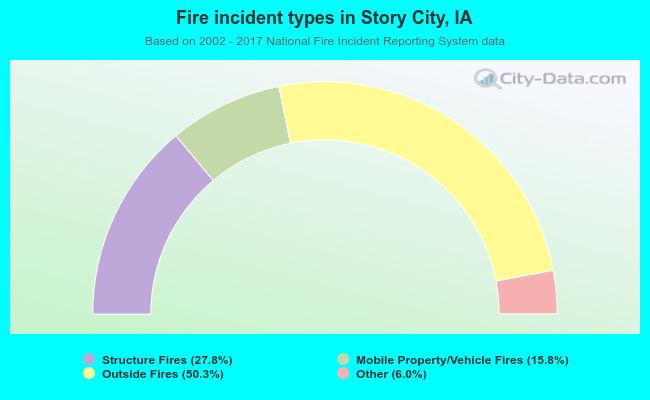 When looking into fire subcategories, the most incidents belonged to: Outside Fires (50.3%), and Structure Fires (27.8%).