Strong City: Fire Incidents, Kansas (KS)
Where are fire incidents reported in Strong City, KS
Something went wrong! Please refresh the page.
|
| |||||||||||||||||||||||||||||||||||||||||||||||||||||||||||||||||||||||||||||
| Other | 24 | |||||||||||||||||||||||||||||||||||||||||||||||||||||||||||||||||||||||||||||
2002 - 2018 National Fire Incident Reporting System (NFIRS) incidents
- Incident types reported to NFIRS in Strong City, KS
- 10287.2%Fire
- 54.3%Good Intent Call
- 43.4%Rescue & EMS
- 43.4%Hazardous Condition
- 10.9%Overpressure Rupture
- 10.9%Service Call
- Fire incident types reported to NFIRS in Strong City, KS
- 6462.7%Outside Fires
- 1817.6%Structure Fires
- 1817.6%Mobile Property/Vehicle Fires
- 22.0%Other
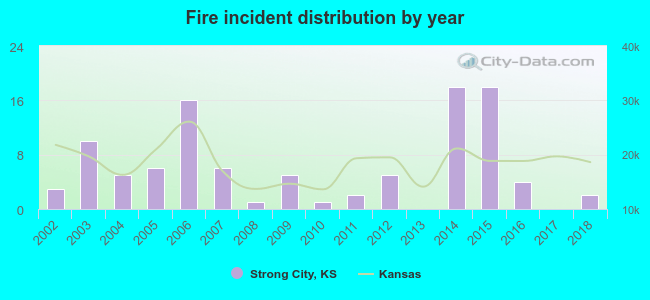 Based on the data from the years 2002 - 2018 the average number of fires per year is 6. The highest number of fires - 18 took place in 2014, and the least - 0 in 2013. The data has a dropping trend.
 35.3% incidents where reported in the morning and 64.7% in the evening. The most fires (21.6%) took place on Monday, and the least (5.9%) on Thursday.
 Based on the 102 reports from years 2002 - 2018 most fires (26.5%) took place during April, and the least (1.0%) in November.
 Out of all 117 cases reported during the years 2002 - 2018, the most belonged to the categories: Fire (87.2%), Good Intent Call (4.3%), and Rescue & EMS (3.4%).
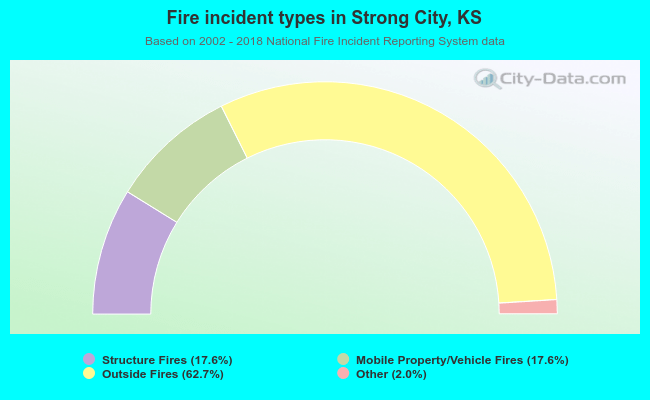 When looking into fire subcategories, the most incidents belonged to: Outside Fires (62.7%), and Structure Fires (17.6%).