Stuart: Fire Incidents, Iowa (IA)
Where are fire incidents reported in Stuart, IA
Something went wrong! Please refresh the page.
|
| |||||||||||||||||||||||||||||||||||||||||||||||||||||||||||||||||||||||||||||||||||||||||||||||||||||||||||||
| Other | 71 | |||||||||||||||||||||||||||||||||||||||||||||||||||||||||||||||||||||||||||||||||||||||||||||||||||||||||||||
2003 - 2018 National Fire Incident Reporting System (NFIRS) incidents
- Incident types reported to NFIRS in Stuart, IA
- 31557.0%Fire
- 14526.2%Rescue & EMS
- 417.4%Hazardous Condition
- 162.9%Service Call
- 162.9%Good Intent Call
- 112.0%Severe Weather
- 61.1%False Alarm
- 30.5%Special Incident
- Fire incident types reported to NFIRS in Stuart, IA
- 15248.3%Outside Fires
- 12138.4%Structure Fires
- 3611.4%Mobile Property/Vehicle Fires
- 61.9%Other
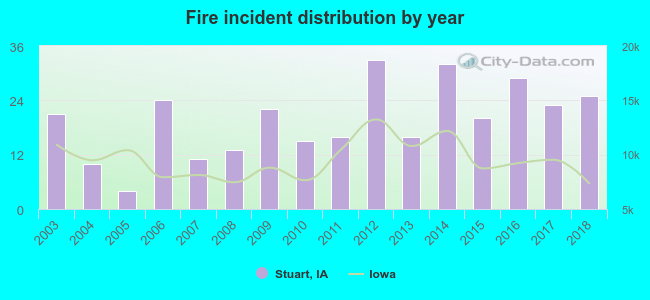 According to the data from the years 2003 - 2018 the average number of fire incidents per year is 20. The highest number of reported fire incidents - 33 took place in 2012, and the least - 4 in 2005. The data has an increasing trend.
 29.5% incidents where reported in the morning and 70.5% in the evening. The most fires (15.9%) took place on Saturday, and the least (13.0%) on Tuesday.
 Based on the 315 fire incident reports from years 2003 - 2018 most fires (16.8%) took place during April, and the least (4.8%) in June.
 Out of all 553 cases reported during the years 2003 - 2018, the most belonged to the categories: Fire (57.0%), Overpressure Rupture (26.2%), and Rescue & EMS (7.4%).
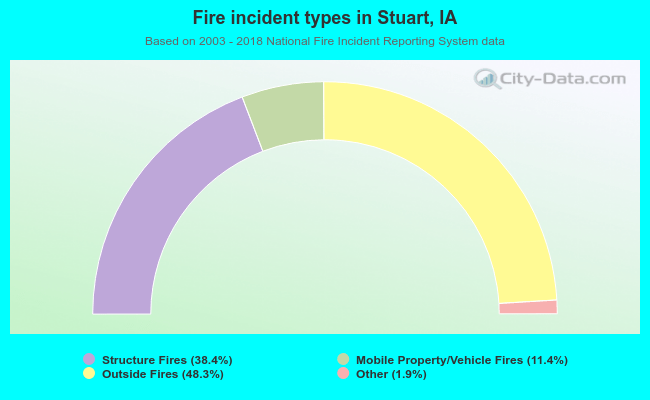 When looking into fire subcategories, the most incidents belonged to: Outside Fires (48.3%), and Structure Fires (38.4%).