Sugar Grove: Fire Incidents, Illinois (IL)
Where are fire incidents reported in Sugar Grove, IL
Something went wrong! Please refresh the page.
| Fire incidents reported | |
|---|---|
| Sreet name | Count |
| RT 47 | 90 |
| JERICHO RD | 74 |
| RT 30 | 60 |
| PRAIRIE ST | 50 |
| PRAIRIE STREET | 36 |
| BLISS RD | 34 |
| HARTER RD | 34 |
| BARNES RD | 30 |
| NORRIS RD | 24 |
| RT 47 ST | 20 |
| CAPITOL DR | 18 |
| JERICHO ROAD | 18 |
| RT 56 | 18 |
| BLISS ROAD | 16 |
| DEERPATH RD | 16 |
| HANKES RD | 16 |
| I88 HWY | 16 |
| TERRY DR | 16 |
| HARTER ROAD | 14 |
| I 88 /REAGAN MEMORIAL | 14 |
| MAPLE STREET | 14 |
| MEADOWS DR | 14 |
| MERRILL ROAD | 14 |
| RT 30 ST | 14 |
| SCOTT RD | 14 |
| SNOW ST | 14 |
| DENNY RD | 12 |
| GALENA BLVD | 12 |
| MAIN ST | 12 |
| MIGHELL RD | 12 |
| Other | 186 |
2002 - 2018 National Fire Incident Reporting System (NFIRS) incidents
- Incident types reported to NFIRS in Sugar Grove, IL
- 3,52551.3%Rescue & EMS
- 93213.6%Fire
- 71510.4%Hazardous Condition
- 5838.5%Service Call
- 5628.2%False Alarm
- 5447.9%Good Intent Call
- 80.1%Overpressure Rupture
- Fire incident types reported to NFIRS in Sugar Grove, IL
- 39142.0%Structure Fires
- 36338.9%Outside Fires
- 12913.8%Mobile Property/Vehicle Fires
- 495.3%Other
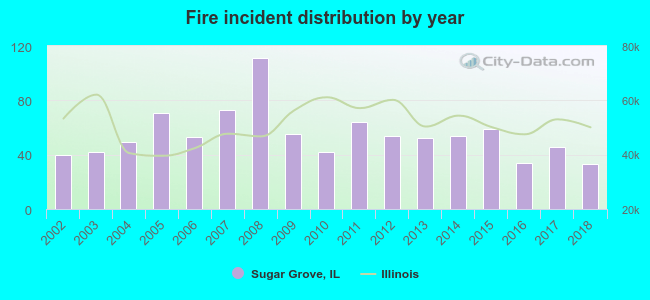 According to the data from the years 2002 - 2018 the average number of fires per year is 55. The highest number of fires - 111 took place in 2008, and the least - 33 in 2018. The data has a decreasing trend.
The average number of yearly fire incidents per 10k residents in Sugar Grove, IL compared to nearest cities:
(Note: Based on data for the last 3 years, including only cities with population 5,000 and above)
| Sugar Grove: | 41.0 |
| North Aurora: | 16.9 |
| Montgomery: | 37.0 |
| Aurora: | 11.7 |
| Oswego: | 18.8 |
| Elburn: | 84.5 |
| Batavia: | 30.0 |
| Yorkville: | 42.2 |
| Plano: | 31.3 |
 The median response time based on all reported fire incidents is 7 minutes. This is higher than the state median value.
The median response time in Sugar Grove, IL compared to nearest cities:
(Note: Based on data for all years, including only cities with at least 500 fire incidents)
| Sugar Grove: | 7 minutes |
| North Aurora: | 5 minutes |
| Montgomery: | 6 minutes |
| Aurora: | 5 minutes |
| Oswego: | 6 minutes |
| Elburn: | 8 minutes |
| Batavia: | 5 minutes |
| Yorkville: | 6 minutes |
| Plano: | 6 minutes |
 According to the data from the years 2002 - 2018 the average number of fire-related casualties per year is 0. The highest number of injuries - 2 took place in 2007, and the lowest - 0 in 2002. The data has a constant trend.
The average number of injuries per 1,000 fires is 4. This indicator was the highest - 27 in 2007, and the lowest 0 in 2002. The trend for casualties per 1,000 fires is constant. Compared to the Illinois value the number of injuries per 1,000 fires is much lower.
According to the data from the years 2002 - 2018 the average number of fire-related casualties per year is 0. The highest number of injuries - 2 took place in 2007, and the lowest - 0 in 2002. The data has a constant trend.
The average number of injuries per 1,000 fires is 4. This indicator was the highest - 27 in 2007, and the lowest 0 in 2002. The trend for casualties per 1,000 fires is constant. Compared to the Illinois value the number of injuries per 1,000 fires is much lower.Casualties per 1,000 incidents in Sugar Grove, IL compared to nearest cities:
(Note: Based on data for all years, including only cities with at least 500 fire incidents)
| Sugar Grove: | 4.3 |
| North Aurora: | 0.0 |
| Montgomery: | 20.3 |
| Aurora: | 14.2 |
| Oswego: | 12.3 |
| Elburn: | 1.0 |
| Batavia: | 10.8 |
| Yorkville: | 15.6 |
| Plano: | 0.0 |
 29.3% incidents where reported in the morning and 70.7% in the evening. The most fires (18.9%) took place on Sunday, and the least (11.8%) on Wednesday.
 Based on the 932 fires from years 2002 - 2018 most fires (14.2%) took place during April, and the least (4.1%) in February.
 Out of all 6,876 cases reported during the years 2002 - 2018, the most belonged to the categories: Rescue & EMS (51.3%), Fire (13.6%), and Hazardous Condition (10.4%).
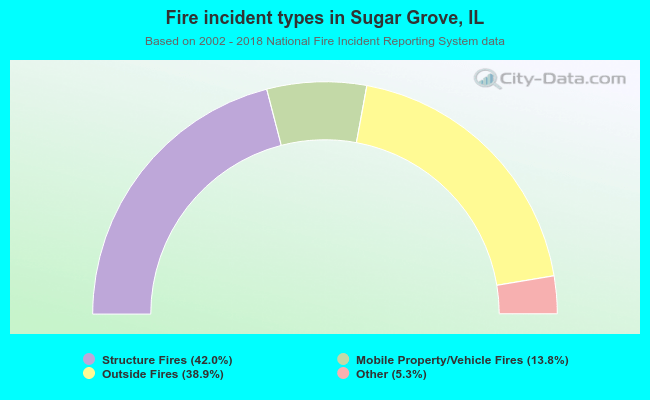 When looking into fire subcategories, the most reports belonged to: Structure Fires (42.0%), and Outside Fires (38.9%).