| Fire incidents reported |
|---|
| Sreet name | Count |
|---|
| CAMP ROAD | 14 | | SUGAR GROVE HIGHWAY | 10 | | FLAT RIDGE ROAD | 8 | | FLATRIDGE RD | 6 | | OLD BRUNSWICK RD | 6 | | 460 FLAT RIDGE ROAD | 4 | | 5805 CHARLIE TAYLOR RD | 4 | | CAMP RD | 4 | | CEDAR SPRINGS | 4 | | DICKEYS CREEK ROAD | 4 | | FLAT RIDGE RD | 4 | | OLD BRUNSWICK ROAD | 4 | | PLEASANT VALLEY RD | 4 | | QUARTER BRANCH RD | 4 | | QUATER BRANCH ROAD | 4 | | SAND MINES RD | 4 | | SLEMP CREEK RD | 4 | | TEAS RD | 4 | | TEAS ROAD | 4 | | VIPPERMAN HOLLOW RD | 4 | | VIPPERMAN HOLLOW ROAD | 4 | | 1032 BLUE SPRINGS RD | 2 | | 1111 CEDAR SPRINGS RD | 2 | | 122 FLAT RIDGE RD | 2 | | 123 QUARTER BRANCH | 2 |
| | | Fire incidents reported |
|---|
| Sreet name | Count |
|---|
| 1290 CAMP ROAD | 2 | | 145 HALE LAKE ROAD | 2 | | 1612 CAMP RD | 2 | | 1882 CAMP ROAD | 2 | | 208 STARLIGHT LANE | 2 | | 2895 IRVIN LANE | 2 | | 312 CEDAR SPRINGS RD | 2 | | 4005 DRY CREEK RD | 2 | | 5362 HIGHWAY SIXTEEN | 2 | | 5408 PINE BLUFF RD | 2 | | 788 TEAS RD | 2 | | BEARLICK RD | 2 | | BEARRIDGE RD | 2 | | BETTER HOMES DR | 2 | | CARROL LN | 2 | | CEADERSPRINGS ROAD | 2 | | CEDAR SPINGS RD | 2 | | CEDAR SPRINGS RD | 2 | | COMERS CREEK RD | 2 | | DEER HOLLOW | 2 | | DEER HOLLOW RD | 2 | | DICKEY'S CREEK ROAD | 2 | | DICKEYS CREEK RD | 2 | | DICKEYS CREEK ROOD | 2 | | FLATRIDE RD | 2 |
|
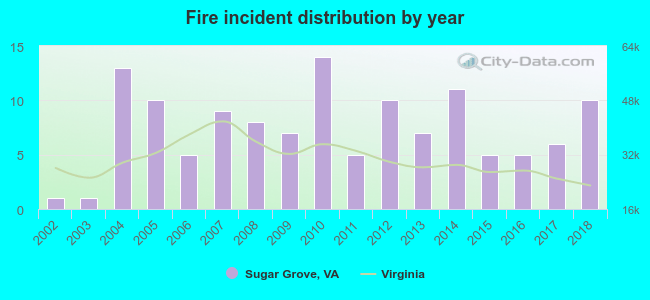 According to the data from the years 2002 - 2018 the average number of fire incidents per year is 7. The highest number of fires - 14 took place in 2010, and the least - 1 in 2002. The data has a growing trend.
 33.9% incidents where reported in the morning and 66.1% in the evening. The most fires (16.5%) took place on Sunday, and the least (12.6%) on Thursday.
 According to the 127 fires from years 2002 - 2018 most fires (14.2%) took place during April, and the least (3.1%) in July.
 Out of all 218 cases reported during the years 2002 - 2018, the most belonged to the categories: Fire (58.3%), Overpressure Rupture (25.2%), and Rescue & EMS (8.7%).
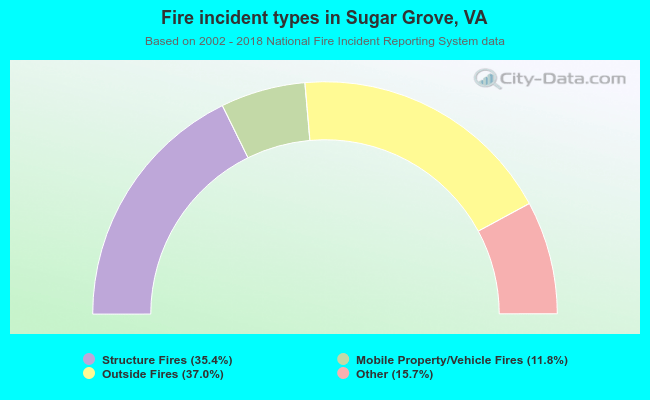 When looking into fire subcategories, the most incidents belonged to: Outside Fires (37.0%), and Structure Fires (35.4%).