| Fire incidents reported |
|---|
| Sreet name | Count |
|---|
| MONTGOMERY MILL RD | 8 | | GUMM SPRINGS RD | 6 | | HUDGINS HWY | 6 | | 453 GABE RD | 4 | | B HALL RD | 4 | | GABE PERKINS RD | 4 | | GABE RD | 4 | | GUMMSPRINGS RD | 4 | | HUDGINS HWY | 4 | | HWY 569 | 4 | | LENA WARD RD | 4 | | LONZIE SCOTT RD | 4 | | POWDER MILL RD | 4 | | 1091 SAND LICK RD | 2 | | 1115 CURRY RD. | 2 | | 1161 MONTGOMERY MILL RD | 2 | | 124 GRAHAM CEM RD | 2 | | 124 GRAHM CEM RD | 2 | | 1245 DESPAIN RD | 2 | | 1323 SCOTT MARCUM RD | 2 | | 1342 BENNETT RD. | 2 | | 144 SPRINGWOOD DRIVE | 2 | | 1625 DOC WARD RD | 2 | | 1636 COPELY RD | 2 | | 169 GRASSY FLAT RD | 2 |
| | | Fire incidents reported |
|---|
| Sreet name | Count |
|---|
| 1754 GABE RD | 2 | | 2215 EVE RD | 2 | | 2531 LONZIE SCOTT RD | 2 | | 2820 HUDGINS HWY | 2 | | 3029 COAKLEY RD | 2 | | 311 G. HAZELWOOD RD | 2 | | 323 | 2 | | 3395 MONTGOMERY MILL RD | 2 | | 3570 POWDER MILL RD | 2 | | 4059 POWDER MILL RD | 2 | | 4139 POWDER MILL RD. | 2 | | 424 TAYLORS CHAPEL RD | 2 | | 4250 SUMMERSVILLE RD | 2 | | 457 W.E. LOBB DRIVE | 2 | | 470 J. CANTRAL RD | 2 | | 470 J. CANTRALL RD | 2 | | 4860 HUDGINS HWY | 2 | | 491 W E LOBB DRIVE | 2 | | 497 WE LOBB DRIVE | 2 | | 566 HWY | 2 | | 569 SUMMERSVILLE RD | 2 | | 59 CAMPGROUND RD | 2 | | 6267 HODGENVILLE RD | 2 | | 6552 HODGENVILLE ROAD | 2 | | |
|
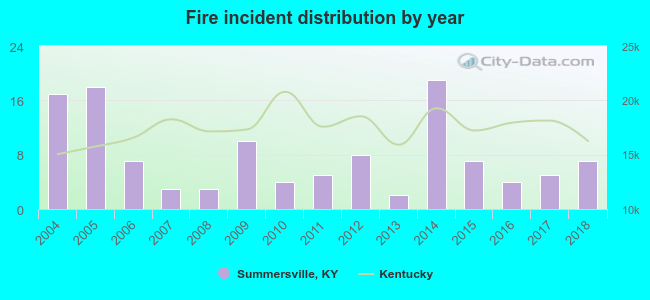 Based on the data from the years 2004 - 2018 the average number of fire incidents per year is 8. The highest number of reported fire incidents - 19 took place in 2014, and the least - 2 in 2013. The data has a dropping trend.
 33.6% incidents where reported in the morning and 66.4% in the evening. The most fires (23.5%) took place on Saturday, and the least (7.6%) on Monday.
 Based on the 119 reports from years 2004 - 2018 most fires (24.4%) took place during February, and the least (0.8%) in December.
 Out of all 240 cases reported during the years 2004 - 2018, the most belonged to the categories: Fire (49.6%), Overpressure Rupture (33.8%), and Rescue & EMS (5.4%).
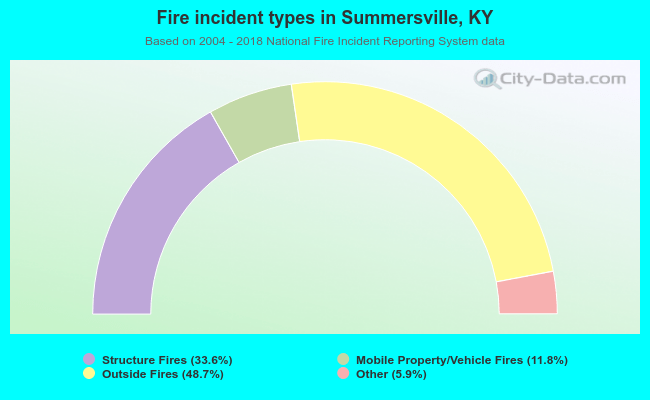 When looking into fire subcategories, the most reports belonged to: Outside Fires (48.7%), and Structure Fires (33.6%).