| Fire incidents reported |
|---|
| Sreet name | Count |
|---|
| HWY 14 | 20 | | I-90 FWY | 14 | | HWY 116 | 12 | | HWY 585 | 12 | | MILLER CREEK RD | 12 | | I-90 | 10 | | INTERSTATE 90 FWY | 10 | | MAIN ST | 10 | | HIGHWAY 14 HWY | 6 | | 3RD ST | 4 | | BANKS RD | 4 | | BEARLODGE ROAD | 4 | | BEAVER CREEK | 4 | | BEAVER CREEK RD | 4 | | DOUGLAS COUNTY ROAD RD | 4 | | FERREL ROAD RD | 4 | | FOREST SERVICE | 4 | | HIGHWAY 14 | 4 | | HIGHWAY 24 HWY | 4 | | HIGHWAY 585 | 4 | | HWY 116 | 4 | | HWY 111 HWY | 4 | | HWY 24 | 4 | | HWY 585 HWY | 4 | | KARA CREEK | 4 |
| | | Fire incidents reported |
|---|
| Sreet name | Count |
|---|
| MOSKEE ROAD HWY | 4 | | OAK CREEK ROAD RD | 4 | | 114 ALDIN ST | 2 | | 135 KARA MOUNTAIN ROAD | 2 | | 190 BEAR CLAW TRAIL | 2 | | 27 BANKS RD | 2 | | 280 HKAY ROAD | 2 | | 3 PEAK TRAIL | 2 | | 3994 STATE HWY 24 | 2 | | 428 BEAVER CREEK ROAD | 2 | | 5 REMINGTON ROAD | 2 | | 52N 64W WEST OF WARREN PEAK | 2 | | 5TH | 2 | | 821 ARCH CREEK | 2 | | 907 SW STREET1 | 2 | | ALDEN | 2 | | ALDEN ST | 2 | | ALDEN STREET ST | 2 | | ARCH CREEK RD | 2 | | ARCH CREEK ROAD | 2 | | BANKS RD | 2 | | BASIN DRAW | 2 | | BEAVER CREEKUPPER COAL DIVIDE | 2 | | BLAKEMAN TRAILER CT | 2 | | |
|
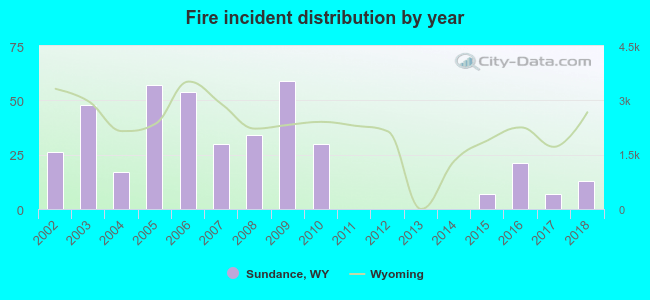 According to the data from the years 2002 - 2018 the average number of fires per year is 24. The highest number of reported fires - 59 took place in 2009, and the least - 0 in 2011. The data has a decreasing trend.
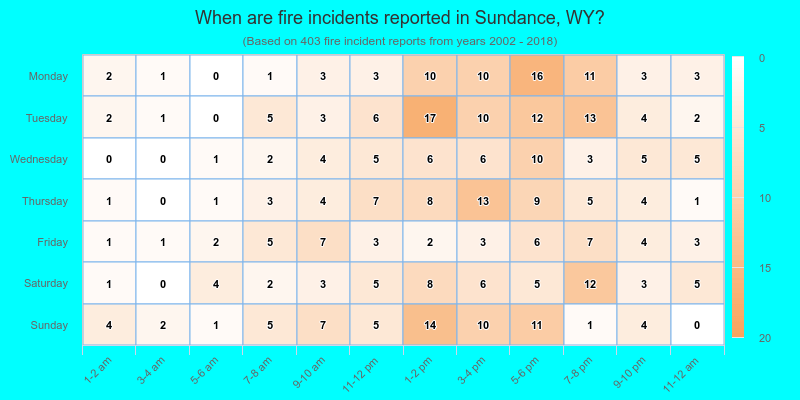
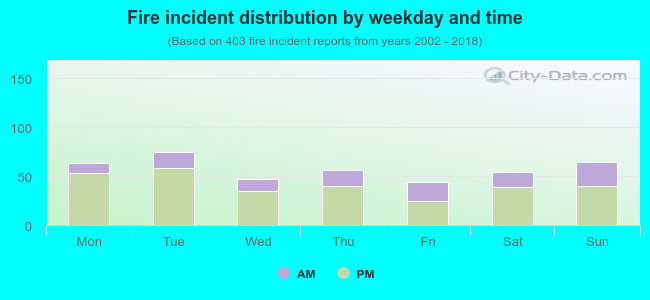 28.0% incidents where reported in the morning and 72.0% in the evening. The most fires (18.6%) took place on Tuesday, and the least (10.9%) on Friday.
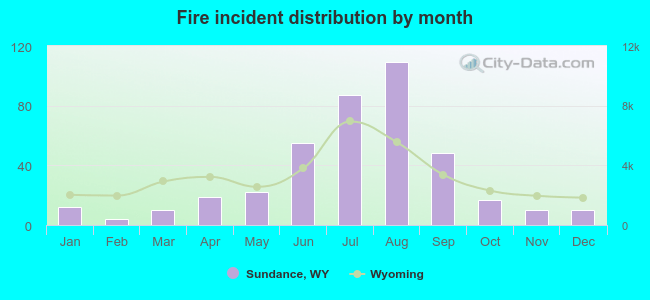 According to the 403 fire incidents from years 2002 - 2018 most fires (27.0%) took place during August, and the least (1.0%) in February.
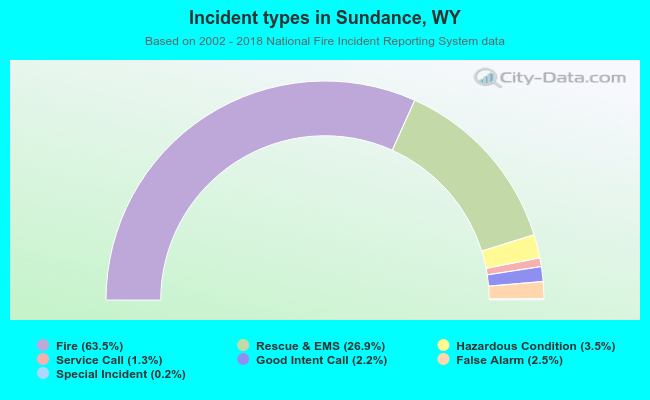 Out of all 635 cases reported during the years 2002 - 2018, the most belonged to the categories: Fire (63.5%), Overpressure Rupture (26.9%), and Rescue & EMS (3.5%).
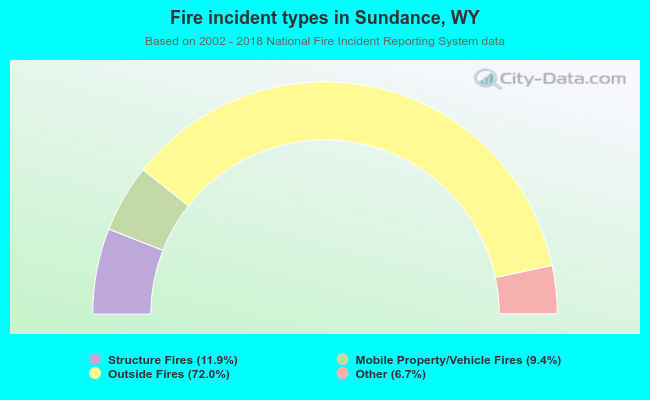 When looking into fire subcategories, the most reports belonged to: Outside Fires (72.0%), and Structure Fires (11.9%).