Surf City: Fire Incidents, New Jersey (NJ)
Where are fire incidents reported in Surf City, NJ
Something went wrong! Please refresh the page.
|
| |||||||||||||||||||||||||||||||||||||||||||||||||||||||||||||||||||||||||||||||||||||||||||||||||||||||||||||
2004 - 2017 National Fire Incident Reporting System (NFIRS) incidents
- Incident types reported to NFIRS in Surf City, NJ
- 41957.7%Hazardous Condition
- 18024.8%Fire
- 598.1%Rescue & EMS
- 283.9%False Alarm
- 253.4%Good Intent Call
- 141.9%Service Call
- 10.1%Severe Weather
- Fire incident types reported to NFIRS in Surf City, NJ
- 8547.2%Structure Fires
- 6335.0%Other
- 2715.0%Outside Fires
- 52.8%Mobile Property/Vehicle Fires
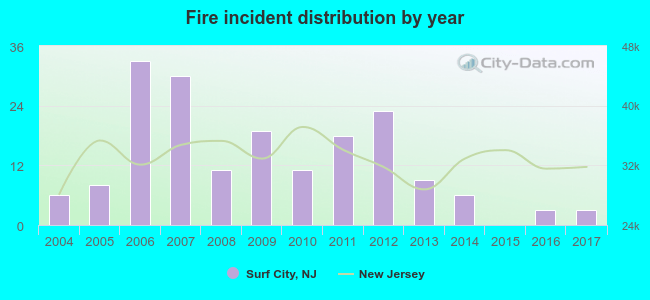 According to the data from the years 2004 - 2017 the average number of fire incidents per year is 13. The highest number of fire incidents - 33 took place in 2006, and the least - 0 in 2015. The data has a dropping trend.
 26.7% incidents where reported in the morning and 73.3% in the evening. The most fires (20.6%) took place on Saturday, and the least (8.3%) on Tuesday.
 Based on the 180 reports from years 2004 - 2017 most fires (16.7%) took place during December, and the least (2.8%) in November.
 Out of all 726 cases reported during the years 2004 - 2017, the most belonged to the categories: Rescue & EMS (57.7%), Fire (24.8%), and Overpressure Rupture (8.1%).
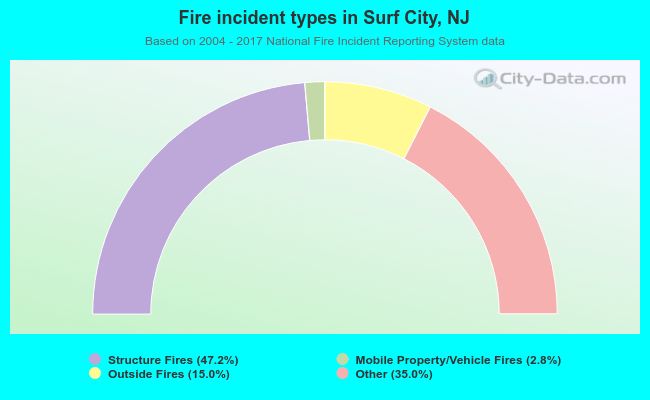 When looking into fire subcategories, the most incidents belonged to: Structure Fires (47.2%), and Other (35.0%).