Surry: Fire Incidents, Virginia (VA)
Where are fire incidents reported in Surry, VA
Something went wrong! Please refresh the page.
|
| |||||||||||||||||||||||||||||||||||||||||||||||||||||||||||||||||||||||||||||||||||||||||||||||||||||||||||||
2002 - 2018 National Fire Incident Reporting System (NFIRS) incidents
- Incident types reported to NFIRS in Surry, VA
- 79456.6%Hazardous Condition
- 41829.8%Fire
- 866.1%Good Intent Call
- 423.0%Rescue & EMS
- 292.1%Service Call
- 271.9%False Alarm
- 30.2%Severe Weather
- 20.1%Special Incident
- Fire incident types reported to NFIRS in Surry, VA
- 22052.6%Outside Fires
- 12028.7%Structure Fires
- 6816.3%Mobile Property/Vehicle Fires
- 102.4%Other
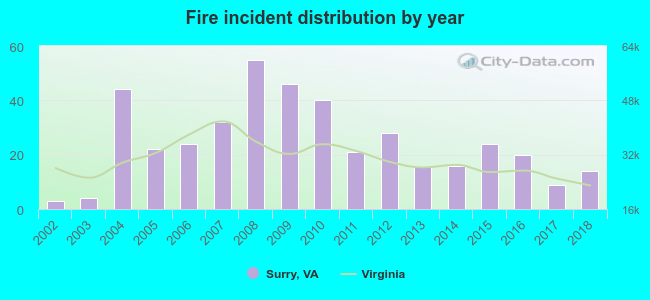 According to the data from the years 2002 - 2018 the average number of fire incidents per year is 25. The highest number of fires - 55 took place in 2008, and the least - 3 in 2002. The data has a growing trend.
 According to the data from the years 2002 - 2018 the average number of fire-related casualties per year is 0. The highest number of reported casualties - 1 took place in 2004, and the lowest - 0 in 2002. The data has a constant trend.
 24.6% incidents where reported in the morning and 75.4% in the evening. The most fires (16.3%) took place on Saturday, and the least (12.9%) on Friday.
 According to the 418 fire incident reports from years 2002 - 2018 most fires (12.0%) took place during March, and the least (5.7%) in June.
 Out of all 1,402 cases reported during the years 2002 - 2018, the most belonged to the categories: Hazardous Condition (56.6%), Fire (29.8%), and Good Intent Call (6.1%).
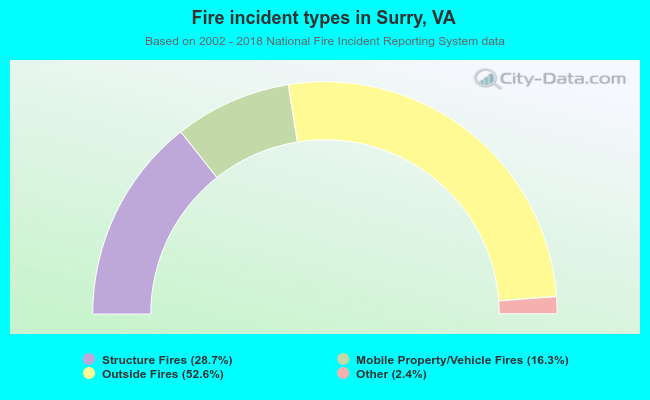 When looking into fire subcategories, the most reports belonged to: Outside Fires (52.6%), and Structure Fires (28.7%).