Sussex: Fire Incidents, New Jersey (NJ)
Where are fire incidents reported in Sussex, NJ
Something went wrong! Please refresh the page.
|
| |||||||||||||||||||||||||||||||||||||||||||||||||||||||||||||||||||||||||||||||||||||||||||||||||||||||||||||
| Other | 10 | |||||||||||||||||||||||||||||||||||||||||||||||||||||||||||||||||||||||||||||||||||||||||||||||||||||||||||||
2002 - 2018 National Fire Incident Reporting System (NFIRS) incidents
- Incident types reported to NFIRS in Sussex, NJ
- 47031.0%Hazardous Condition
- 37024.4%Fire
- 29119.2%Rescue & EMS
- 15810.4%False Alarm
- 1006.6%Good Intent Call
- 815.3%Service Call
- 442.9%Special Incident
- Fire incident types reported to NFIRS in Sussex, NJ
- 21357.6%Structure Fires
- 9625.9%Outside Fires
- 3710.0%Mobile Property/Vehicle Fires
- 246.5%Other
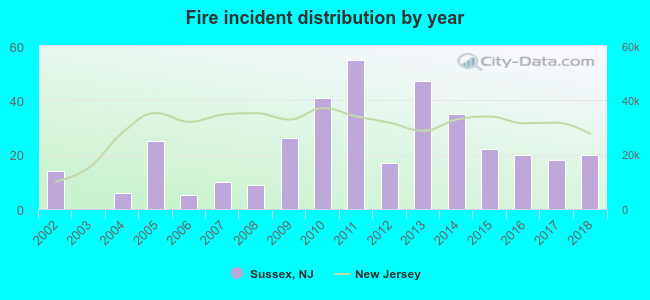 According to the data from the years 2002 - 2018 the average number of fire incidents per year is 22. The highest number of fire incidents - 55 took place in 2011, and the least - 0 in 2003. The data has a growing trend.
 Based on the reports from the years 2002 - 2018 the average number of fire-related casualties per year is 0. The highest number of injuries - 1 took place in 2007, and the lowest - 0 in 2002. The data has a constant trend.
 29.2% incidents where reported in the morning and 70.8% in the evening. The most fires (17.0%) took place on Sunday, and the least (11.4%) on Monday.
 Based on the 370 incident reports from years 2002 - 2018 most fires (14.6%) took place during April, and the least (2.2%) in September.
 Out of all 1,515 cases reported during the years 2002 - 2018, the most belonged to the categories: Hazardous Condition (31.0%), Fire (24.4%), and Rescue & EMS (19.2%).
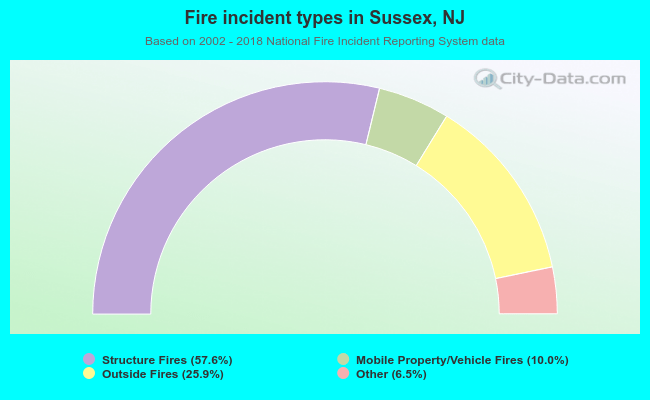 When looking into fire subcategories, the most reports belonged to: Structure Fires (57.6%), and Outside Fires (25.9%).