| Fire incidents reported |
|---|
| Sreet name | Count |
|---|
| 500 SR 22 | 6 | | 600 | 6 | | 10500 S 700 W | 4 | | 108 S 3RD STREET | 4 | | 111 WEST CLARK STREET | 4 | | 119 W ADAMS STREET | 4 | | 38TH MILLER AVE | 4 | | 400 | 4 | | 4420 S 450 W | 4 | | 450 W SR 22 | 4 | | LYONS ST | 4 | | STATE ROAD 13 | 4 | | 0400 N 1000 W | 2 | | 0470 S 900 W | 2 | | 050 W 500 S | 2 | | 100 WEST LYONS | 2 | | 100S 850W | 2 | | 101 LYONS | 2 | | 104 SOUTH TAYLOR STREET | 2 | | 105 W MARK STREET | 2 | | 106 N. MAIN | 2 | | 107 TAYLOR ST | 2 | | 1084 W 650 S | 2 | | 109 HOWARD SIMS | 2 | | 11 S. WASHINGTON ST-SIMS | 2 |
| | | Fire incidents reported |
|---|
| Sreet name | Count |
|---|
| 1302 E. LYONS | 2 | | 1400 W SR 22 | 2 | | 150 406 S | 2 | | 1900W 50TH | 2 | | 200 1200 W | 2 | | 201 HOBART ST SIMS | 2 | | 2038 S ROSEBURG PIKE | 2 | | 205 E. HOBART - SIMS | 2 | | 2050 W 300 S | 2 | | 2092 S 900W | 2 | | 217 N 900 W | 2 | | 2213 W 38TH STREET | 2 | | 2417 S 975 W | 2 | | 2515 S 600 W | 2 | | 2617 600 W | 2 | | 2686 S 300 W | 2 | | 2784 W 38TH | 2 | | 2876 300 S | 2 | | 300 RD | 2 | | 300 S | 2 | | 300 S 200 W | 2 | | 300 S 300 W | 2 | | 300 S 900 W | 2 | | 300 S/MILLER AVE | 2 | | |
|
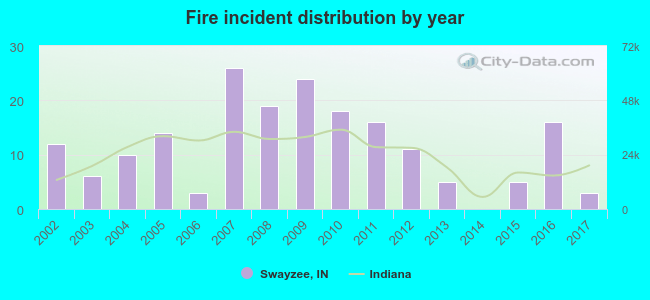 Based on the data from the years 2002 - 2017 the average number of fires per year is 12. The highest number of fire incidents - 26 took place in 2007, and the least - 0 in 2014. The data has a dropping trend.
 27.1% incidents where reported in the morning and 72.9% in the evening. The most fires (17.6%) took place on Saturday, and the least (11.2%) on Thursday.
 According to the 188 fire incidents from years 2002 - 2017 most fires (15.4%) took place during March, and the least (3.7%) in December.
 Out of all 354 cases reported during the years 2002 - 2017, the most belonged to the categories: Fire (53.1%), Hazardous Condition (23.2%), and Rescue & EMS (12.7%).
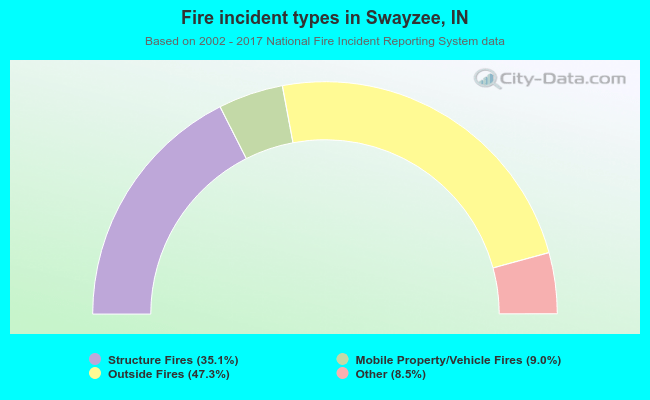 When looking into fire subcategories, the most incidents belonged to: Outside Fires (47.3%), and Structure Fires (35.1%).