Sylva: Fire Incidents, North Carolina (NC)
Where are fire incidents reported in Sylva, NC
Something went wrong! Please refresh the page.
|
| |||||||||||||||||||||||||||||||||||||||||||||||||||||||||||||||||||||||||||||||||||||||||||||||||||||||||||||
| Other | 627 | |||||||||||||||||||||||||||||||||||||||||||||||||||||||||||||||||||||||||||||||||||||||||||||||||||||||||||||
2002 - 2018 National Fire Incident Reporting System (NFIRS) incidents
- Incident types reported to NFIRS in Sylva, NC
- 2,00536.3%Hazardous Condition
- 1,53627.8%Rescue & EMS
- 93716.9%Fire
- 58310.5%Good Intent Call
- 3135.7%Service Call
- 1292.3%False Alarm
- 160.3%Severe Weather
- 80.1%Special Incident
- Fire incident types reported to NFIRS in Sylva, NC
- 53356.9%Structure Fires
- 21823.3%Outside Fires
- 13814.7%Mobile Property/Vehicle Fires
- 485.1%Other
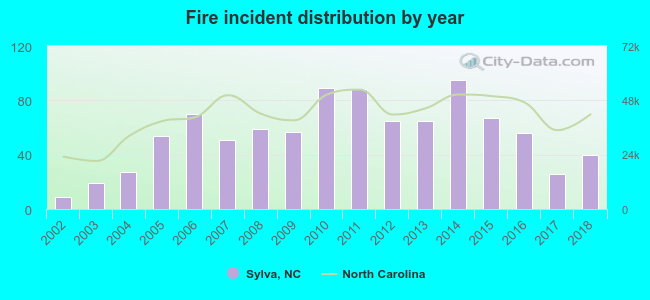 According to the data from the years 2002 - 2018 the average number of fires per year is 55. The highest number of reported fires - 95 took place in 2014, and the least - 9 in 2002. The data has an increasing trend.
 The median response time based on all reported fire incidents is 7 minutes. This is about the same as the North Carolina median value.
The median response time in Sylva, NC compared to nearest cities:
(Note: Based on data for all years, including only cities with at least 500 fire incidents)
| Sylva: | 7 minutes |
| Cherokee: | 5 minutes |
| Bryson City: | 9 minutes |
| Waynesville: | 9 minutes |
| Franklin: | 8 minutes |
| Clyde: | 10 minutes |
| Canton: | 9 minutes |
| Brevard: | 7 minutes |
| Asheville: | 4 minutes |
 32.9% incidents where reported in the morning and 67.1% in the evening. The most fires (17.3%) took place on Friday, and the least (12.4%) on Tuesday.
 Based on the 937 reports from years 2002 - 2018 most fires (12.8%) took place during April, and the least (4.4%) in August.
 Out of all 5,530 cases reported during the years 2002 - 2018, the most belonged to the categories: Hazardous Condition (36.3%), Rescue & EMS (27.8%), and Fire (16.9%).
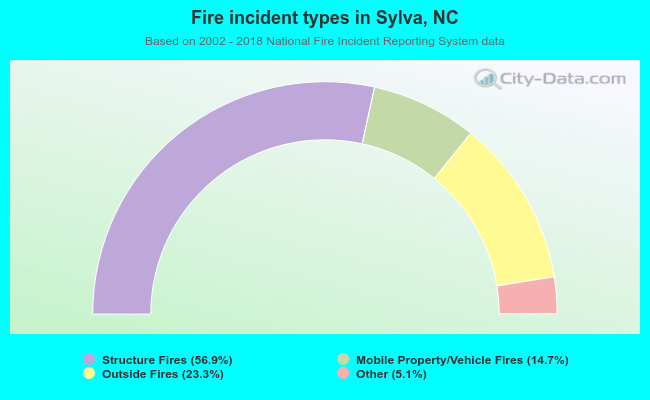 When looking into fire subcategories, the most reports belonged to: Structure Fires (56.9%), and Outside Fires (23.3%).