Sylvan Beach: Fire Incidents, New York (NY)
Where are fire incidents reported in Sylvan Beach, NY
Something went wrong! Please refresh the page.
|
| |||||||||||||||||||||||||||||||||||||||||||||||||||||||||||||||||||||||||||||||||||||||||||||||||||||||||||||
2004 - 2018 National Fire Incident Reporting System (NFIRS) incidents
- Incident types reported to NFIRS in Sylvan Beach, NY
- 62856.6%Rescue & EMS
- 13312.0%Fire
- 12911.6%Service Call
- 1089.7%Hazardous Condition
- 776.9%Good Intent Call
- 161.4%False Alarm
- 161.4%Severe Weather
- 20.2%Overpressure Rupture
- Fire incident types reported to NFIRS in Sylvan Beach, NY
- 8362.4%Structure Fires
- 2821.1%Outside Fires
- 2115.8%Mobile Property/Vehicle Fires
- 10.8%Other
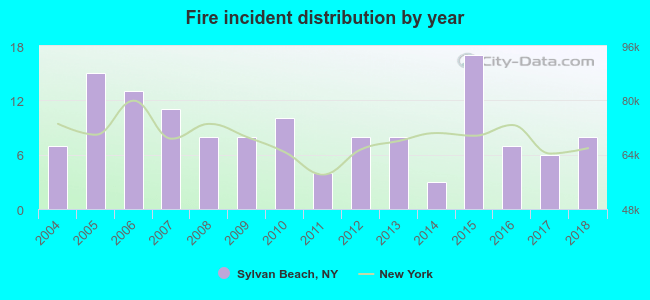 According to the data from the years 2004 - 2018 the average number of fire incidents per year is 9. The highest number of fires - 17 took place in 2015, and the least - 3 in 2014. The data has an increasing trend.
 32.3% incidents where reported in the morning and 67.7% in the evening. The most fires (21.8%) took place on Sunday, and the least (11.3%) on Thursday.
 Based on the 133 fire incident reports from years 2004 - 2018 most fires (14.3%) took place during April, and the least (4.5%) in October.
 Out of all 1,110 cases reported during the years 2004 - 2018, the most belonged to the categories: Rescue & EMS (56.6%), Fire (12.0%), and Service Call (11.6%).
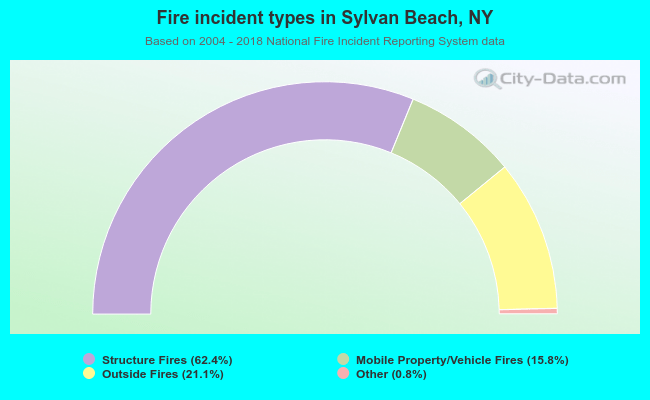 When looking into fire subcategories, the most incidents belonged to: Structure Fires (62.4%), and Outside Fires (21.1%).