Sylvania: Fire Incidents, Ohio (OH)
Where are fire incidents reported in Sylvania, OH
Something went wrong! Please refresh the page.
| Fire incidents reported | |
|---|---|
| Sreet name | Count |
| MONROE ST | 138 |
| ALEXIS RD | 96 |
| MAIN ST | 72 |
| BRINT RD | 70 |
| SYLVANIA AVE | 54 |
| PARKGATE PL | 42 |
| ERIE ST | 40 |
| WHITEFORD RD | 34 |
| MAPLEWOOD AVE | 32 |
| CENTENNIAL RD | 28 |
| CENTRAL AVE | 28 |
| HARROUN RD | 28 |
| KING RD | 26 |
| MCCORD RD | 26 |
| WICKFORD GREEN RD | 24 |
| ACRES RD | 22 |
| HOLLAND-SYLVANIA RD | 22 |
| US 23 NB | 22 |
| US 23 SB | 20 |
| CONVENT BLVD | 18 |
| SILICA DR | 18 |
| DELLBROOK DR | 16 |
| MCGREGOR LA | 16 |
| WICKFORD DR | 16 |
| BALFOUR RD | 14 |
| GLASGOW RD | 14 |
| NEW ENGLAND LA | 14 |
| SUMMIT ST | 14 |
| SYLVANIA-METAMORA RD | 14 |
| CHARLESGATE RD | 12 |
2002 - 2018 National Fire Incident Reporting System (NFIRS) incidents
- Incident types reported to NFIRS in Sylvania, OH
- 6,25056.2%Rescue & EMS
- 1,37812.4%Service Call
- 1,0489.4%Hazardous Condition
- 9698.7%Fire
- 7526.8%Good Intent Call
- 6926.2%False Alarm
- 240.2%Overpressure Rupture
- Fire incident types reported to NFIRS in Sylvania, OH
- 49651.2%Structure Fires
- 30831.8%Outside Fires
- 16016.5%Mobile Property/Vehicle Fires
- 50.5%Other
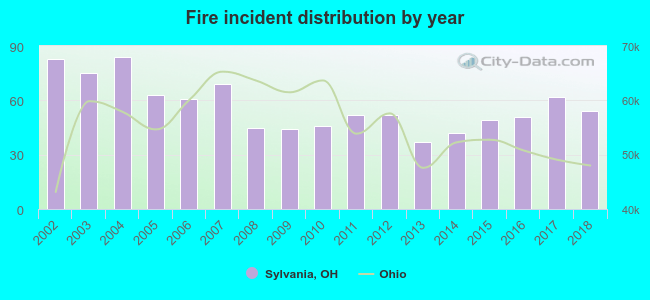 According to the data from the years 2002 - 2018 the average number of fire incidents per year is 57. The highest number of reported fire incidents - 84 took place in 2004, and the least - 37 in 2013. The data has a dropping trend.
The average number of yearly fire incidents per 10k residents in Sylvania, OH compared to nearest cities:
(Note: Based on data for the last 3 years, including only cities with population 5,000 and above)
| Sylvania: | 29.4 |
| Toledo: | 41.6 |
| Maumee: | 38.2 |
| Rossford: | 41.5 |
| Perrysburg: | 46.6 |
| Northwood: | 84.3 |
| Oregon: | 15.7 |
| Waterville: | 43.5 |
| Bowling Green: | 23.2 |
 The median response time based on all reported fire incidents is 5 minutes. This is lower than the state median value.
The median response time in Sylvania, OH compared to nearest cities:
(Note: Based on data for all years, including only cities with at least 500 fire incidents)
| Sylvania: | 5 minutes |
| Holland: | 7 minutes |
| Toledo: | 4 minutes |
| Temperance: | 6 minutes |
| Maumee: | 5 minutes |
| Rossford: | 6 minutes |
| Perrysburg: | 7 minutes |
| Northwood: | 7 minutes |
| Swanton: | 9 minutes |
 Based on the data from the years 2002 - 2018 the average number of fire-related yearly deaths is 0. The highest number of reported deaths - 1 took place in 2005, and the lowest - 0 in 2002. The data has a constant trend.
 According to the data from the years 2002 - 2018 the average number of fire-related casualties per year is 2. The highest number of reported casualties - 7 took place in 2002, and the lowest - 0 in 2006. The data has a decreasing trend.
The average number of injuries per 1,000 fires is 41. This indicator was the highest - 111 in 2008, and the lowest 0 in 2006. The trend for casualties per 1,000 incidents is decreasing. Compared to the Ohio value the number of injuries per 1,000 incidents is much higher.
According to the data from the years 2002 - 2018 the average number of fire-related casualties per year is 2. The highest number of reported casualties - 7 took place in 2002, and the lowest - 0 in 2006. The data has a decreasing trend.
The average number of injuries per 1,000 fires is 41. This indicator was the highest - 111 in 2008, and the lowest 0 in 2006. The trend for casualties per 1,000 incidents is decreasing. Compared to the Ohio value the number of injuries per 1,000 incidents is much higher.Casualties per 1,000 incidents in Sylvania, OH compared to nearest cities:
(Note: Based on data for all years, including only cities with at least 500 fire incidents)
| Sylvania: | 42.3 |
| Holland: | 12.6 |
| Toledo: | 13.2 |
| Temperance: | 16.2 |
| Maumee: | 29.2 |
| Rossford: | 11.5 |
| Perrysburg: | 6.5 |
| Northwood: | 10.7 |
| Swanton: | 7.0 |
 29.4% incidents where reported in the morning and 70.6% in the evening. The most fires (17.8%) took place on Sunday, and the least (11.5%) on Wednesday.
 According to the 969 fire incidents from years 2002 - 2018 most fires (11.9%) took place during July, and the least (5.9%) in January.
 Out of all 11,125 cases reported during the years 2002 - 2018, the most belonged to the categories: Rescue & EMS (56.2%), Service Call (12.4%), and Hazardous Condition (9.4%).
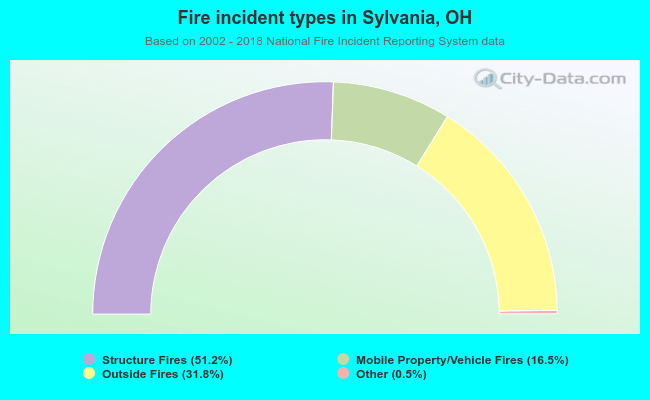 When looking into fire subcategories, the most reports belonged to: Structure Fires (51.2%), and Outside Fires (31.8%).