Symsonia: Fire Incidents, Kentucky (KY)
Where are fire incidents reported in Symsonia, KY
Something went wrong! Please refresh the page.
|
| |||||||||||||||||||||||||||||||||||||||||||||||||||||||||||||||||||||||||||||||||||||||||||||||||||||||||||||
2003 - 2018 National Fire Incident Reporting System (NFIRS) incidents
- Incident types reported to NFIRS in Symsonia, KY
- 21254.5%Rescue & EMS
- 12131.1%Fire
- 215.4%Good Intent Call
- 133.3%Service Call
- 102.6%Hazardous Condition
- 82.1%False Alarm
- 41.0%Severe Weather
- Fire incident types reported to NFIRS in Symsonia, KY
- 5747.1%Structure Fires
- 4537.2%Outside Fires
- 1512.4%Mobile Property/Vehicle Fires
- 43.3%Other
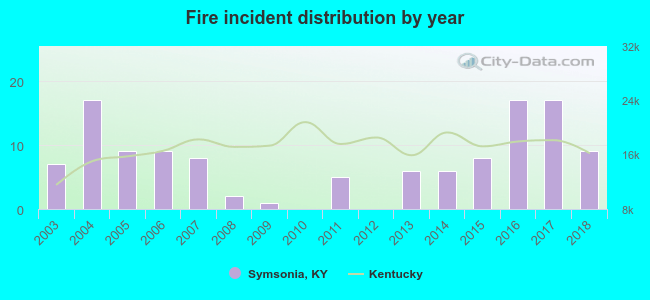 Based on the data from the years 2003 - 2018 the average number of fire incidents per year is 8. The highest number of reported fire incidents - 17 took place in 2004, and the least - 0 in 2010. The data has a growing trend.
The average number of yearly fire incidents per 10k residents in Symsonia, KY compared to nearest cities:
(Note: Based on data for the last 3 years, including only cities with population 5,000 and above)
| Symsonia: | 26.7 |
| Mayfield: | 79.0 |
| Paducah: | 70.1 |
| Fairdealing: | 1.6 |
| Murray: | 67.1 |

 33.9% incidents where reported in the morning and 66.1% in the evening. The most fires (19.0%) took place on Friday, and the least (9.1%) on Monday.
 Based on the 121 reports from years 2003 - 2018 most fires (15.7%) took place during February, and the least (4.1%) in June.
 Out of all 389 cases reported during the years 2003 - 2018, the most belonged to the categories: Overpressure Rupture (54.5%), Fire (31.1%), and Service Call (5.4%).
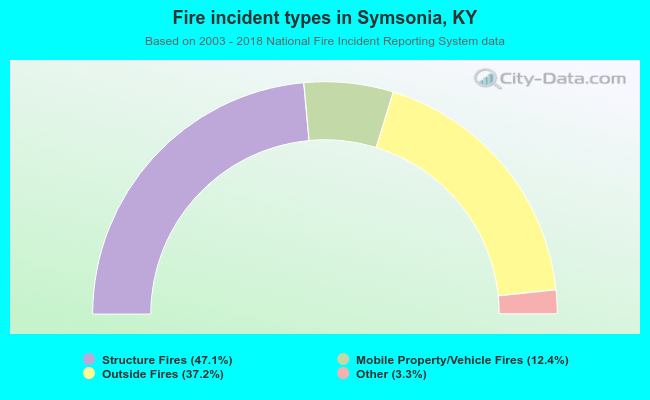 When looking into fire subcategories, the most reports belonged to: Structure Fires (47.1%), and Outside Fires (37.2%).