Tacoma: Fire Incidents, Washington (WA)
Where are fire incidents reported in Tacoma, WA
Something went wrong! Please refresh the page.
| Fire incidents reported | |
|---|---|
| Sreet name | Count |
| PACIFIC AVE | 892 |
| I5 | 738 |
| 6TH AVE | 604 |
| 72ND ST | 468 |
| STEELE ST | 448 |
| PEARL ST | 414 |
| PORTLAND AVE | 384 |
| YAKIMA AVE | 384 |
| G ST | 376 |
| J ST | 376 |
| 38TH ST | 366 |
| MARINE | 366 |
| PACIFIC AV | 352 |
| A ST | 348 |
| I ST | 342 |
| 56TH ST | 336 |
| M ST | 336 |
| TACOMA AVE | 324 |
| SOUTH | 310 |
| 96TH ST | 308 |
| FAWCETT AVE | 304 |
| HOSMER ST | 302 |
| D ST | 300 |
| S 19TH ST | 280 |
| TACOMA | 280 |
| 509 | 276 |
| L ST | 276 |
| 16 | 272 |
| UNION AVE | 262 |
| S 56TH ST | 258 |
| Other | 11,383 |
2002 - 2018 National Fire Incident Reporting System (NFIRS) incidents
- Incident types reported to NFIRS in Tacoma, WA
- 178,64363.5%Rescue & EMS
- 24,1428.6%Service Call
- 22,6658.1%Fire
- 22,2817.9%Good Intent Call
- 14,8675.3%Hazardous Condition
- 11,4814.1%False Alarm
- 7,2602.6%Special Incident
- Fire incident types reported to NFIRS in Tacoma, WA
- 13,43659.3%Outside Fires
- 5,71325.2%Structure Fires
- 3,25714.4%Mobile Property/Vehicle Fires
- 2591.1%Other
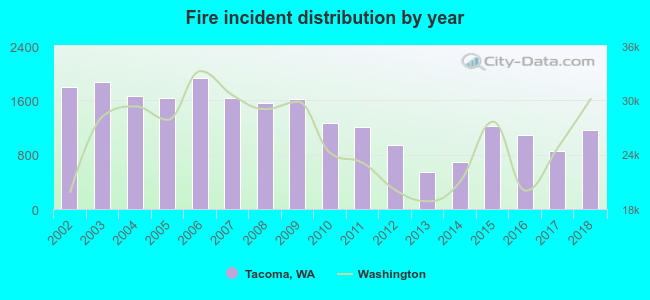 Based on the data from the years 2002 - 2018 the average number of fire incidents per year is 1,333. The highest number of fires - 1,928 took place in 2006, and the least - 544 in 2013. The data has a dropping trend.
The average number of yearly fire incidents per 10k residents in Tacoma, WA compared to nearest cities:
(Note: Based on data for the last 3 years, including only cities with population 5,000 and above)
| Tacoma: | 50.3 |
| Fircrest: | 9.5 |
| University Place: | 13.1 |
| Fife: | 68.8 |
| Lakewood: | 25.9 |
| Milton: | 38.0 |
| Parkland: | 53.9 |
| Federal Way: | 46.6 |
| Steilacoom: | 8.1 |
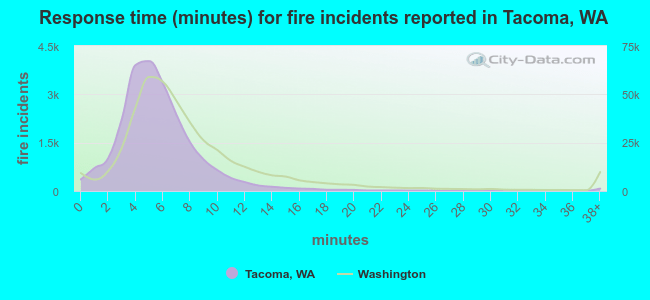 The median response time based on all reported fire incidents is 5 minutes. This is lower than the Washington median value.
The median response time in Tacoma, WA compared to nearest cities:
(Note: Based on data for all years, including only cities with at least 500 fire incidents)
| Tacoma: | 5 minutes |
| University Place: | 6 minutes |
| Fife: | 5 minutes |
| Lakewood: | 7 minutes |
| Milton: | 7 minutes |
| Parkland: | 6 minutes |
| Federal Way: | 6 minutes |
| Edgewood: | 7 minutes |
| Gig Harbor: | 9 minutes |
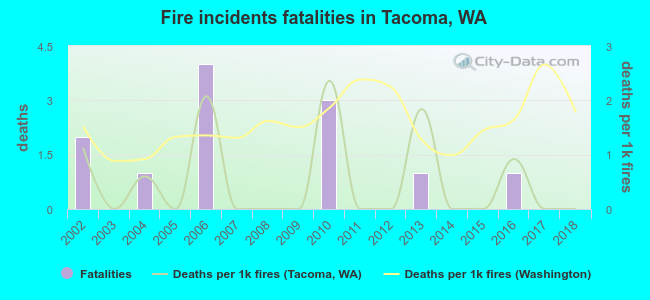 Based on the reports from the years 2002 - 2018 the average number of fire-related yearly deaths is 1. The highest number of deaths - 4 took place in 2006, and the lowest - 0 in 2003. The data has a declining trend.
The average number of fatalities per 1,000 fire incidents is 1. This indicator was the highest - 2 in 2010, and the lowest 0 in 2003. The trend for deaths per 1,000 fire incidents is declining. Compared to the state value the number of deaths per 1,000 incidents is much lower.
Based on the reports from the years 2002 - 2018 the average number of fire-related yearly deaths is 1. The highest number of deaths - 4 took place in 2006, and the lowest - 0 in 2003. The data has a declining trend.
The average number of fatalities per 1,000 fire incidents is 1. This indicator was the highest - 2 in 2010, and the lowest 0 in 2003. The trend for deaths per 1,000 fire incidents is declining. Compared to the state value the number of deaths per 1,000 incidents is much lower.
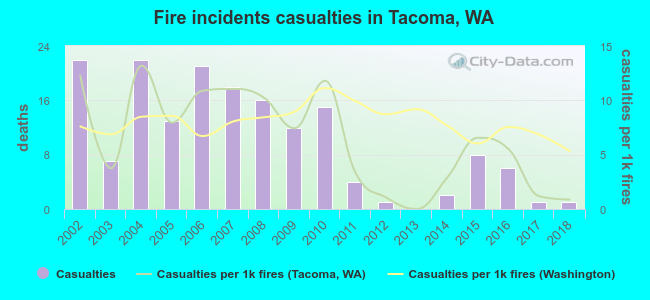 According to the data from the years 2002 - 2018 the average number of fire-related casualties per year is 10. The highest number of injuries - 22 took place in 2002, and the lowest - 0 in 2013. The data has a dropping trend.
The average number of casualties per 1,000 fire incidents is 6. This indicator was the highest - 13 in 2004, and the lowest 0 in 2013. The trend for injuries per 1,000 fires is dropping. Compared to the state value the number of casualties per 1,000 fire incidents is similar.
According to the data from the years 2002 - 2018 the average number of fire-related casualties per year is 10. The highest number of injuries - 22 took place in 2002, and the lowest - 0 in 2013. The data has a dropping trend.
The average number of casualties per 1,000 fire incidents is 6. This indicator was the highest - 13 in 2004, and the lowest 0 in 2013. The trend for injuries per 1,000 fires is dropping. Compared to the state value the number of casualties per 1,000 fire incidents is similar.Casualties per 1,000 incidents in Tacoma, WA compared to nearest cities:
(Note: Based on data for all years, including only cities with at least 500 fire incidents)
| Tacoma: | 7.5 |
| University Place: | 2.5 |
| Fife: | 3.3 |
| Lakewood: | 3.2 |
| Milton: | 3.5 |
| Parkland: | 18.1 |
| Federal Way: | 21.1 |
| Edgewood: | 3.6 |
| Gig Harbor: | 15.1 |
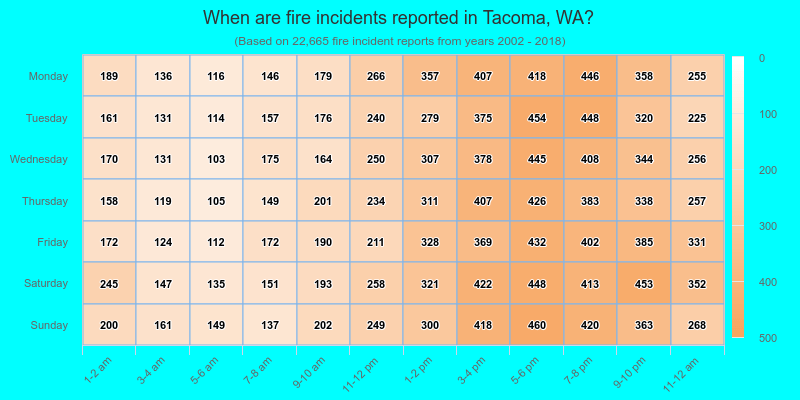
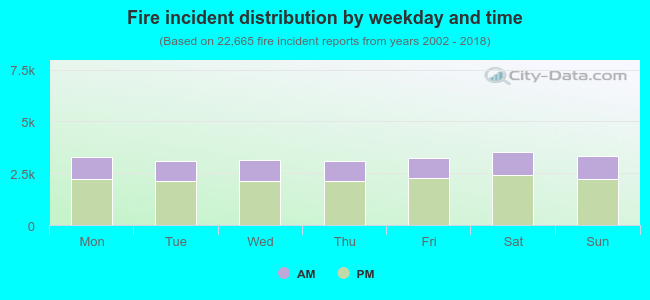 31.7% incidents where reported in the morning and 68.3% in the evening. The most fires (15.6%) took place on Saturday, and the least (13.6%) on Tuesday.
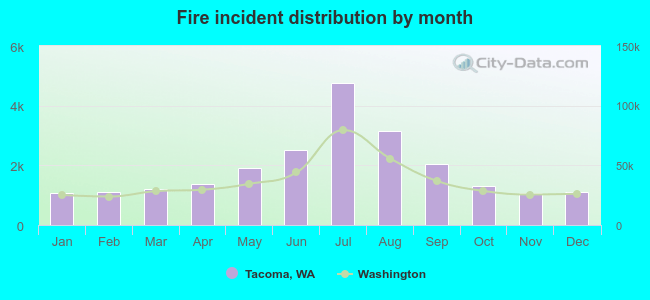 Based on the 22,665 fire incidents from years 2002 - 2018 most fires (21.0%) took place during July, and the least (4.7%) in January.
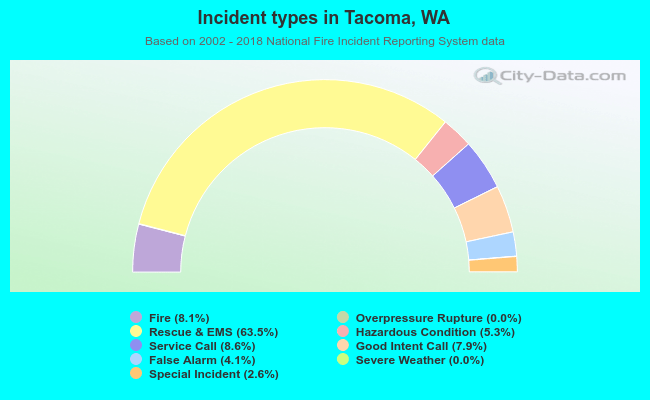 Out of all 281,530 cases reported during the years 2002 - 2018, the most belonged to the categories: Rescue & EMS (63.5%), Service Call (8.6%), and Fire (8.1%).
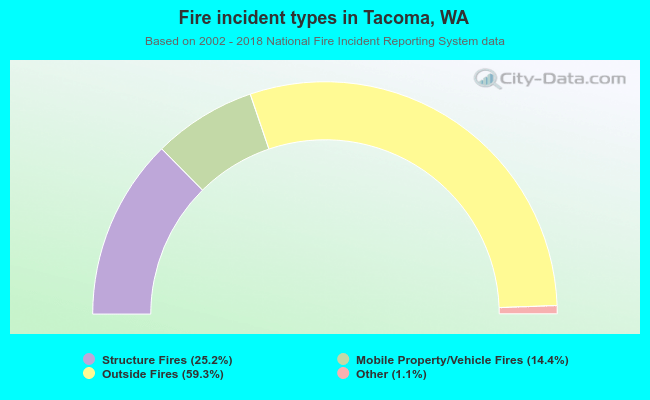 When looking into fire subcategories, the most reports belonged to: Outside Fires (59.3%), and Structure Fires (25.2%).