| Fire incidents reported |
|---|
| Sreet name | Count |
|---|
| MAIN ST | 38 | | TARLTON RD | 28 | | ARMSTRONG RD | 24 | | MOCCASIN RD | 16 | | GERMAN ST | 10 | | HARRISON ST | 10 | | SIXTEENTH RD | 10 | | TARLTON-ADELPHI RD | 10 | | JACKSON RD | 8 | | KIME-HOLDERMAN RD | 8 | | PLEASANT ST | 8 | | REDDING ST | 8 | | SOUTH PERRY RD | 8 | | SPANGLER RD | 8 | | TARLTONADELPHI RD | 8 | | MAIN ST | 6 | | MOWERY RD | 6 | | OH SR 159 | 6 | | PLEASENT ST | 6 | | ST ROUTE 56 EAST | 6 | | TARLTON RD | 6 | | HAYESVILLE RD | 4 | | MOCCASSIN RD | 4 | | OH SR 56 | 4 | | OHSR 159 | 4 |
| | | Fire incidents reported |
|---|
| Sreet name | Count |
|---|
| PICKAWAY-SALTCREEK RD | 4 | | PINE GROVE RD | 4 | | 16TH RD | 2 | | 6520 TARLTON RD RD | 2 | | CHARLESTON PIKE | 2 | | DELANY ROAD | 2 | | DUPONT RD | 2 | | E MAIN ST ST | 2 | | GARRETT RD | 2 | | GERMAN ST. | 2 | | HEFFNER RD | 2 | | HITLER #2 RD | 2 | | HUBER HITLER RD | 2 | | JACKSON RD. | 2 | | KIME HOLDERMAN RD | 2 | | KIME HOLDERMAN RD. RD | 2 | | KINGSTONWHISSLER RD | 2 | | MAIN | 2 | | OTHER RD | 2 | | PICKAWAY ST | 2 | | PINE GROVE RD | 2 | | PLEASANT STREET | 2 | | REDDING STREET | 2 | | RIDDLE ROAD | 2 | | |
|
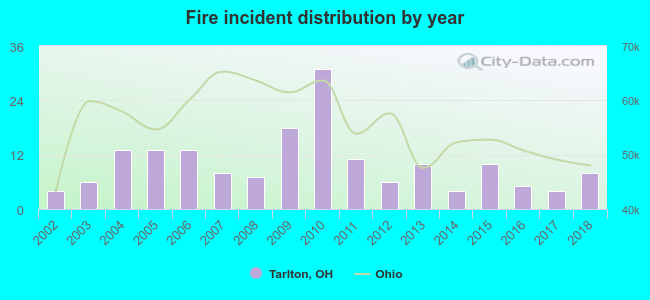 According to the data from the years 2002 - 2018 the average number of fire incidents per year is 10. The highest number of reported fire incidents - 31 took place in 2010, and the least - 4 in 2002. The data has a growing trend.
 25.7% incidents where reported in the morning and 74.3% in the evening. The most fires (19.3%) took place on Saturday, and the least (7.6%) on Sunday.
 According to the 171 fire incident reports from years 2002 - 2018 most fires (16.4%) took place during September, and the least (4.7%) in January.
 Out of all 294 cases reported during the years 2002 - 2018, the most belonged to the categories: Fire (58.2%), Rescue & EMS (20.4%), and Hazardous Condition (12.9%).
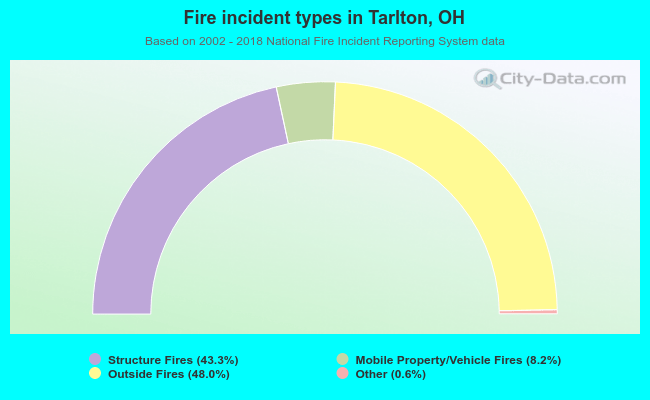 When looking into fire subcategories, the most incidents belonged to: Outside Fires (48.0%), and Structure Fires (43.3%).