Tarpon Springs: Fire Incidents, Florida (FL)
Where are fire incidents reported in Tarpon Springs, FL
Something went wrong! Please refresh the page.
| Fire incidents reported | |
|---|---|
| Sreet name | Count |
| US 19 HWY | 288 |
| PINELLAS AVE | 128 |
| ANCLOTE RD | 94 |
| KEYSTONE RD | 80 |
| EAST LAKE RD | 74 |
| LIME ST | 66 |
| TARPON AVE | 58 |
| US 19 N HWY | 54 |
| FLORIDA AVE | 52 |
| DODECANESE BLVD | 48 |
| RIVERSIDE DR | 46 |
| MANGO CIR | 42 |
| STARLIGHT COVE | 42 |
| ISLAND AVE | 38 |
| JASMINE AVE | 38 |
| LIVE OAK ST | 38 |
| GULF RD | 34 |
| ALT 19 | 32 |
| BOYER ST | 32 |
| HIGHLAND AVE | 32 |
| WALTON AVE | 32 |
| KLOSTERMAN RD | 30 |
| CARLTON RD | 28 |
| CHESAPEAKE DR | 28 |
| ROOSEVELT BLVD | 26 |
| WATERFORD CIR | 26 |
| TARPON E AVE | 24 |
| WACASSASSA ST | 24 |
| ANCLOTE BLVD | 22 |
| BAYSHORE DR | 22 |
| Other | 136 |
2005 - 2018 National Fire Incident Reporting System (NFIRS) incidents
- Incident types reported to NFIRS in Tarpon Springs, FL
- 15,24064.4%Rescue & EMS
- 3,02912.8%Good Intent Call
- 2,1118.9%Hazardous Condition
- 1,7147.2%Fire
- 1,1204.7%False Alarm
- 3981.7%Service Call
- 290.1%Overpressure Rupture
- Fire incident types reported to NFIRS in Tarpon Springs, FL
- 75844.2%Structure Fires
- 58033.8%Outside Fires
- 24214.1%Mobile Property/Vehicle Fires
- 1347.8%Other
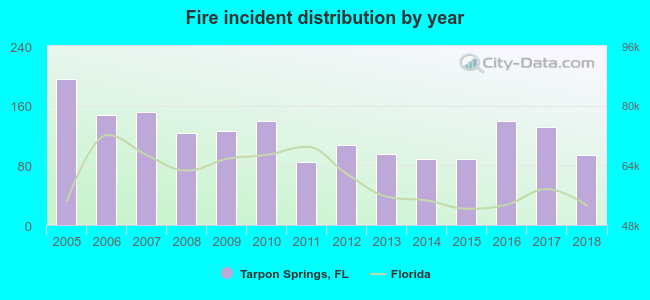 According to the data from the years 2005 - 2018 the average number of fires per year is 122. The highest number of reported fires - 196 took place in 2005, and the least - 84 in 2011. The data has a dropping trend.
The average number of yearly fire incidents per 10k residents in Tarpon Springs, FL compared to nearest cities:
(Note: Based on data for the last 3 years, including only cities with population 5,000 and above)
| Tarpon Springs: | 50.2 |
| Holiday: | 35.6 |
| Palm Harbor: | 25.8 |
| East Lake: | 0.3 |
| Trinity: | 3.7 |
| New Port Richey: | 151.1 |
| Dunedin: | 21.9 |
| Oldsmar: | 49.8 |
| Keystone: | 0.4 |
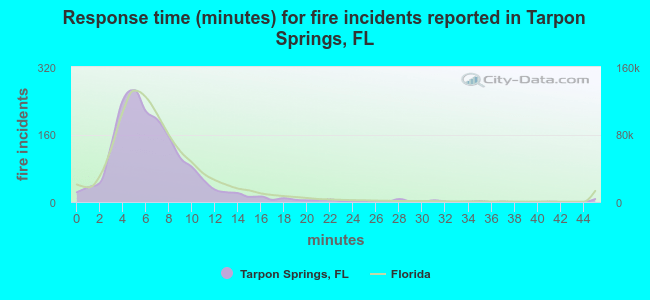 The median response time based on all reported fire incidents is 6 minutes. This is about the same as the Florida median value.
The median response time in Tarpon Springs, FL compared to nearest cities:
(Note: Based on data for all years, including only cities with at least 500 fire incidents)
| Tarpon Springs: | 6 minutes |
| Holiday: | 6 minutes |
| Palm Harbor: | 6 minutes |
| New Port Richey: | 6 minutes |
| Dunedin: | 5 minutes |
| Oldsmar: | 6 minutes |
| Port Richey: | 5 minutes |
| Safety Harbor: | 5 minutes |
| Clearwater: | 5 minutes |
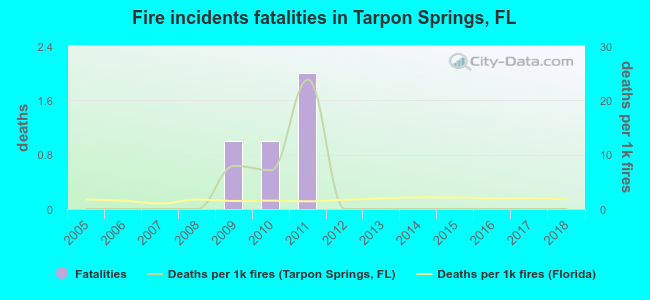 Based on the data from the years 2005 - 2018 the average number of fire-related yearly deaths is 0. The highest number of reported deaths - 2 took place in 2011, and the lowest - 0 in 2005. The data has a constant trend.
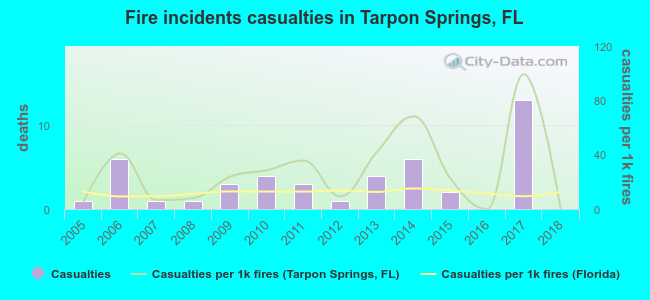 According to the data from the years 2005 - 2018 the average number of fire-related yearly casualties is 3. The highest number of casualties - 13 took place in 2017, and the lowest - 0 in 2016. The data has a declining trend.
The average number of casualties per 1,000 fire incidents is 28. This indicator was the highest - 99 in 2017, and the lowest 0 in 2016. The trend for casualties per 1,000 incidents is dropping. Compared to the state value the number of injuries per 1,000 fires is much higher.
According to the data from the years 2005 - 2018 the average number of fire-related yearly casualties is 3. The highest number of casualties - 13 took place in 2017, and the lowest - 0 in 2016. The data has a declining trend.
The average number of casualties per 1,000 fire incidents is 28. This indicator was the highest - 99 in 2017, and the lowest 0 in 2016. The trend for casualties per 1,000 incidents is dropping. Compared to the state value the number of injuries per 1,000 fires is much higher.Casualties per 1,000 incidents in Tarpon Springs, FL compared to nearest cities:
(Note: Based on data for all years, including only cities with at least 500 fire incidents)
| Tarpon Springs: | 26.3 |
| Holiday: | 46.5 |
| Palm Harbor: | 47.8 |
| New Port Richey: | 25.6 |
| Dunedin: | 55.1 |
| Oldsmar: | 11.4 |
| Port Richey: | 17.5 |
| Safety Harbor: | 48.0 |
| Clearwater: | 49.9 |
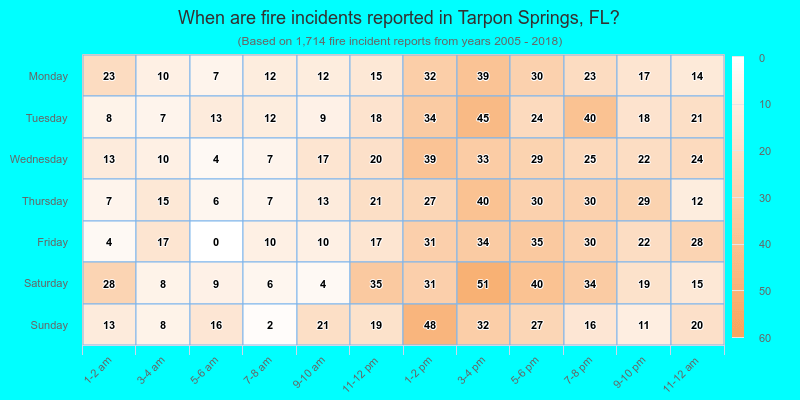
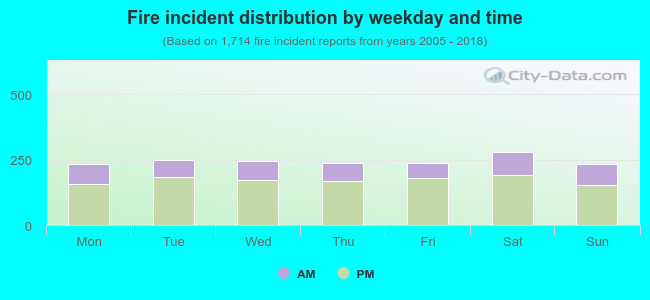 29.9% incidents where reported in the morning and 70.1% in the evening. The most fires (16.3%) took place on Saturday, and the least (13.6%) on Sunday.
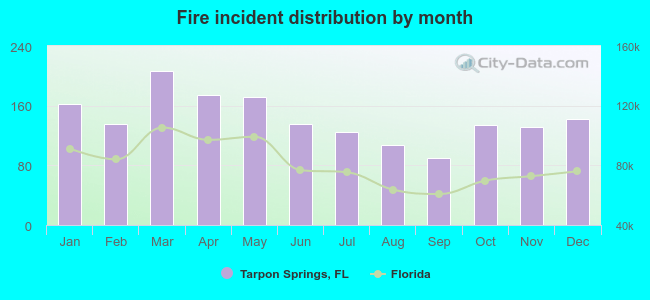 Based on the 1,714 fire incident reports from years 2005 - 2018 most fires (12.1%) took place during March, and the least (5.3%) in September.
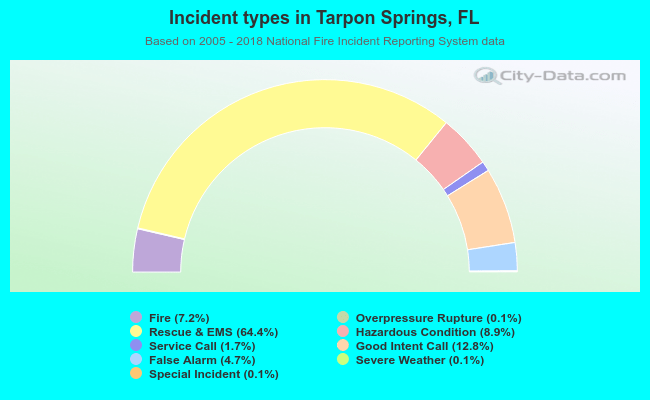 Out of all 23,679 cases reported during the years 2005 - 2018, the most belonged to the categories: Rescue & EMS (64.4%), Good Intent Call (12.8%), and Hazardous Condition (8.9%).
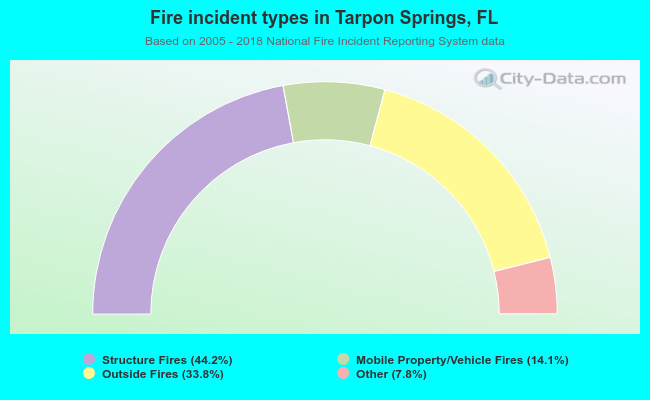 When looking into fire subcategories, the most reports belonged to: Structure Fires (44.2%), and Outside Fires (33.8%).