Tea: Fire Incidents, South Dakota (SD)
Where are fire incidents reported in Tea, SD
Something went wrong! Please refresh the page.
|
| |||||||||||||||||||||||||||||||||||||||||||||||||||||||||||||||||||||||||||||||||||||||||||||||||||||||||||||
| Other | 91 | |||||||||||||||||||||||||||||||||||||||||||||||||||||||||||||||||||||||||||||||||||||||||||||||||||||||||||||
2002 - 2018 National Fire Incident Reporting System (NFIRS) incidents
- Incident types reported to NFIRS in Tea, SD
- 61049.9%Rescue & EMS
- 34528.2%Fire
- 1109.0%Hazardous Condition
- 857.0%False Alarm
- 483.9%Good Intent Call
- 151.2%Service Call
- 50.4%Severe Weather
- 30.2%Special Incident
- Fire incident types reported to NFIRS in Tea, SD
- 14040.6%Structure Fires
- 9226.7%Outside Fires
- 6017.4%Other
- 5315.4%Mobile Property/Vehicle Fires
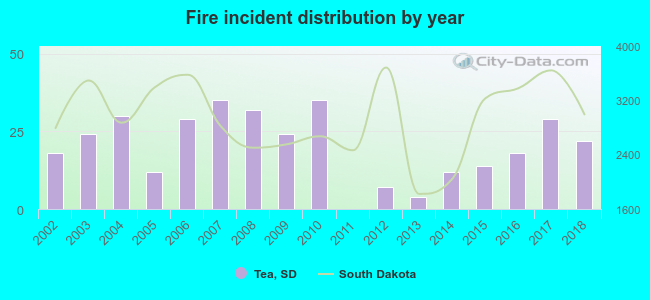 According to the data from the years 2002 - 2018 the average number of fires per year is 20. The highest number of reported fire incidents - 35 took place in 2007, and the least - 0 in 2011. The data has a rising trend.
 30.1% incidents where reported in the morning and 69.9% in the evening. The most fires (16.5%) took place on Friday, and the least (9.9%) on Wednesday.
 According to the 345 incident reports from years 2002 - 2018 most fires (14.5%) took place during March, and the least (4.6%) in May.
 Out of all 1,222 cases reported during the years 2002 - 2018, the most belonged to the categories: Rescue & EMS (49.9%), Fire (28.2%), and Hazardous Condition (9.0%).
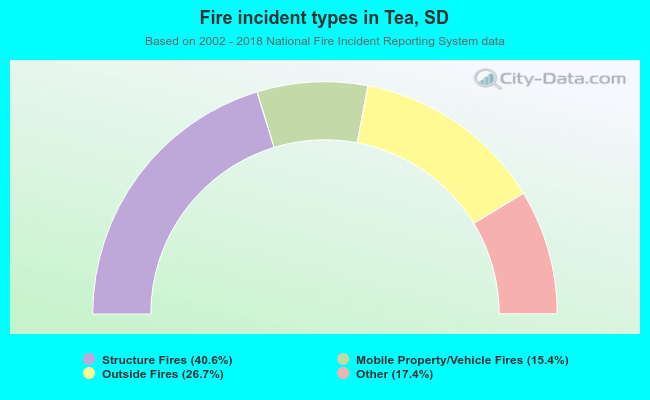 When looking into fire subcategories, the most incidents belonged to: Structure Fires (40.6%), and Outside Fires (26.7%).