Tega Cay: Fire Incidents, South Carolina (SC)
Where are fire incidents reported in Tega Cay, SC
Something went wrong! Please refresh the page.
|
| |||||||||||||||||||||||||||||||||||||||||||||||||||||||||||||||||||||||||||||||||||||||||||||||||||||||||||||
2009 - 2018 National Fire Incident Reporting System (NFIRS) incidents
- Incident types reported to NFIRS in Tega Cay, SC
- 45325.7%Service Call
- 43824.8%Rescue & EMS
- 27815.7%Good Intent Call
- 26414.9%False Alarm
- 1749.9%Hazardous Condition
- 1387.8%Fire
- 140.8%Severe Weather
- 50.3%Overpressure Rupture
- 20.1%Special Incident
- Fire incident types reported to NFIRS in Tega Cay, SC
- 5842.0%Structure Fires
- 5237.7%Outside Fires
- 1510.9%Other
- 139.4%Mobile Property/Vehicle Fires
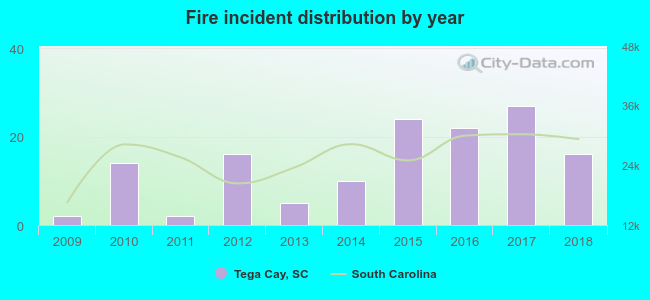 According to the data from the years 2009 - 2018 the average number of fires per year is 14. The highest number of reported fire incidents - 27 took place in 2017, and the least - 2 in 2009. The data has a rising trend.
The average number of yearly fire incidents per 10k residents in Tega Cay, SC compared to nearest cities:
(Note: Based on data for the last 3 years, including only cities with population 5,000 and above)
| Tega Cay: | 23.8 |
| Fort Mill: | 111.3 |
| Lake Wylie: | 3.4 |
| Rock Hill: | 50.2 |
| York: | 138.1 |
| Clover: | 131.4 |
| Chester: | 166.2 |
| Lancaster: | 574.4 |

 20.3% incidents where reported in the morning and 79.7% in the evening. The most fires (21.0%) took place on Saturday, and the least (10.1%) on Tuesday.
 According to the 138 fire incident reports from years 2009 - 2018 most fires (16.7%) took place during January, and the least (2.9%) in October.
 Out of all 1,766 cases reported during the years 2009 - 2018, the most belonged to the categories: Service Call (25.7%), Rescue & EMS (24.8%), and Good Intent Call (15.7%).
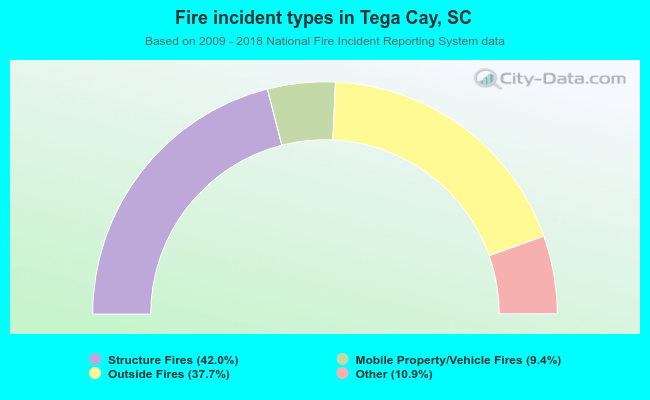 When looking into fire subcategories, the most incidents belonged to: Structure Fires (42.0%), and Outside Fires (37.7%).