Tennyson: Fire Incidents, Indiana (IN)
Where are fire incidents reported in Tennyson, IN
Something went wrong! Please refresh the page.
|
| |||||||||||||||||||||||||||||||||||||||||||||||||||||||||||||||||||||||||||||||||||||||||||||||||||||||||||||
2003 - 2018 National Fire Incident Reporting System (NFIRS) incidents
- Incident types reported to NFIRS in Tennyson, IN
- 18762.8%Fire
- 4715.8%Hazardous Condition
- 3612.1%Rescue & EMS
- 165.4%Good Intent Call
- 62.0%Service Call
- 51.7%False Alarm
- 10.3%Special Incident
- Fire incident types reported to NFIRS in Tennyson, IN
- 8646.0%Structure Fires
- 7238.5%Outside Fires
- 2412.8%Mobile Property/Vehicle Fires
- 52.7%Other
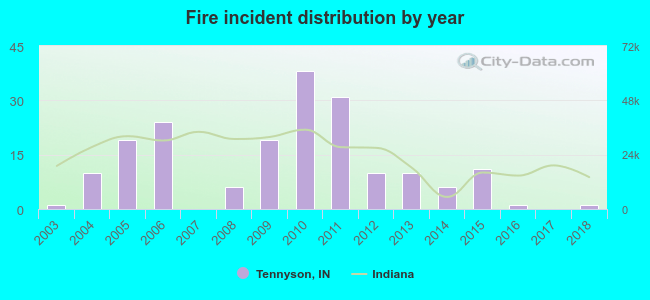 According to the data from the years 2003 - 2018 the average number of fires per year is 12. The highest number of fires - 38 took place in 2010, and the least - 0 in 2007. The data has a constant trend.
 28.3% incidents where reported in the morning and 71.7% in the evening. The most fires (19.3%) took place on Thursday, and the least (10.7%) on Tuesday.
 According to the 187 incident reports from years 2003 - 2018 most fires (15.5%) took place during March, and the least (5.3%) in September.
 Out of all 298 cases reported during the years 2003 - 2018, the most belonged to the categories: Fire (62.8%), Rescue & EMS (15.8%), and Overpressure Rupture (12.1%).
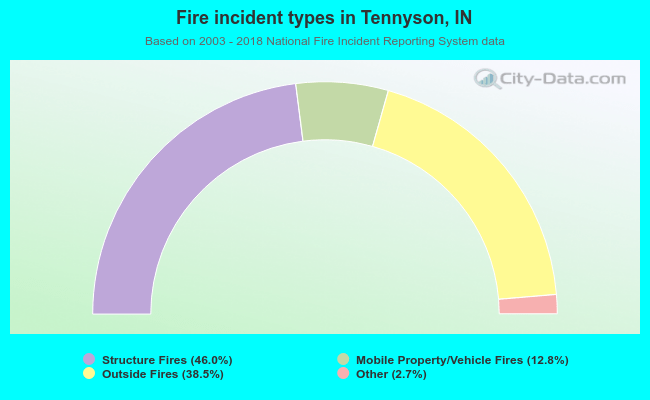 When looking into fire subcategories, the most reports belonged to: Structure Fires (46.0%), and Outside Fires (38.5%).