Texarkana: Fire Incidents, Arkansas (AR)
Where are fire incidents reported in Texarkana, AR
Something went wrong! Please refresh the page.
| Fire incidents reported | |
|---|---|
| Sreet name | Count |
| 35TH ST | 226 |
| COUNTY AVE | 224 |
| EAST ST | 210 |
| 9TH ST | 206 |
| ARKANSAS BLVD | 192 |
| STATE LINE AVE | 190 |
| BROAD ST | 188 |
| WASHINGTON ST | 150 |
| LAUREL ST | 102 |
| LOCUST ST | 102 |
| RONDO RD | 102 |
| 24TH ST | 92 |
| LINKS DR | 90 |
| PECAN ST | 82 |
| JEFFERSON AVE | 76 |
| JACKSON ST | 70 |
| I-30 HWY | 68 |
| FERGUSON ST | 66 |
| HICKORY ST | 66 |
| STATELINE AVE | 66 |
| GENOA RD | 64 |
| I30 | 64 |
| SANDERSON LN | 64 |
| SENATOR ST | 64 |
| BEECH ST | 60 |
| PRESTON ST | 60 |
| DUDLEY ST | 58 |
| OLD POST RD | 54 |
| TENNESSEE RD | 52 |
| 18TH ST | 50 |
| Other | 1,339 |
2002 - 2018 National Fire Incident Reporting System (NFIRS) incidents
- Incident types reported to NFIRS in Texarkana, AR
- 4,49735.1%Fire
- 2,31418.1%Hazardous Condition
- 2,10616.5%Rescue & EMS
- 1,53912.0%Service Call
- 1,2429.7%Good Intent Call
- 1,0568.3%False Alarm
- 200.2%Overpressure Rupture
- 190.1%Severe Weather
- Fire incident types reported to NFIRS in Texarkana, AR
- 1,84941.1%Structure Fires
- 1,81140.3%Outside Fires
- 75816.9%Mobile Property/Vehicle Fires
- 791.8%Other
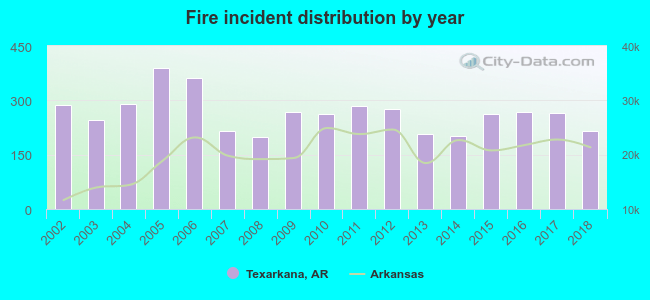 According to the data from the years 2002 - 2018 the average number of fires per year is 265. The highest number of fires - 388 took place in 2005, and the least - 200 in 2008. The data has a declining trend.
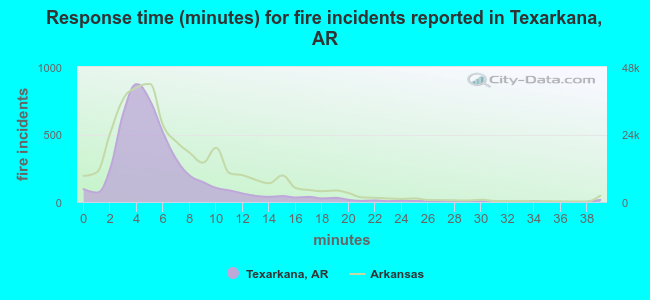 The median response time based on all reported fire incidents is 5 minutes. This is lower compared to the Arkansas median value.
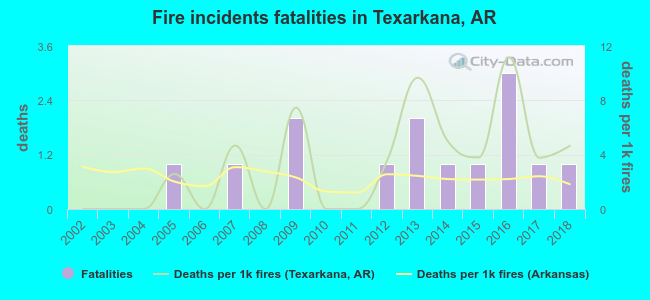 According to the reports from the years 2002 - 2018 the average number of fire-related fatalities per year is 1. The highest number of reported deaths - 3 took place in 2016, and the lowest - 0 in 2002. The data has a growing trend.
The average number of fatalities per 1,000 fires is 3. This indicator was the highest - 11 in 2016, and the lowest 0 in 2002. The trend for deaths per 1,000 fire incidents is increasing. Compared to the Arkansas value the number of fatalities per 1,000 fire incidents is higher.
According to the reports from the years 2002 - 2018 the average number of fire-related fatalities per year is 1. The highest number of reported deaths - 3 took place in 2016, and the lowest - 0 in 2002. The data has a growing trend.
The average number of fatalities per 1,000 fires is 3. This indicator was the highest - 11 in 2016, and the lowest 0 in 2002. The trend for deaths per 1,000 fire incidents is increasing. Compared to the Arkansas value the number of fatalities per 1,000 fire incidents is higher.Deaths per 1,000 incidents in Texarkana, AR compared to nearest cities:
(Note: Based on data for all years, including only cities with at least 2,500 fire incidents)
| Texarkana: | 3.1 |
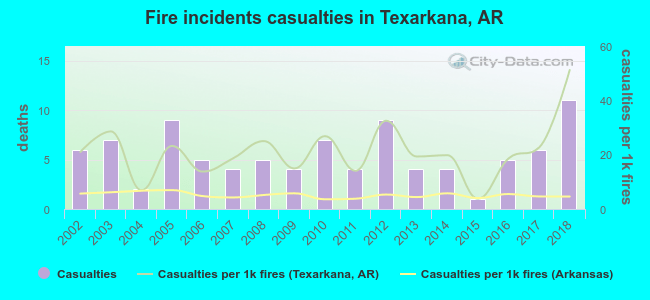 Based on the reports from the years 2002 - 2018 the average number of fire-related yearly casualties is 5. The highest number of reported casualties - 11 took place in 2018, and the lowest - 1 in 2015. The data has an increasing trend.
The average number of casualties per 1,000 fire incidents is 21. This indicator was the highest - 51 in 2018, and the lowest 4 in 2015. The trend for casualties per 1,000 fires is growing. Compared to the Arkansas value the number of casualties per 1,000 fires is much higher.
Based on the reports from the years 2002 - 2018 the average number of fire-related yearly casualties is 5. The highest number of reported casualties - 11 took place in 2018, and the lowest - 1 in 2015. The data has an increasing trend.
The average number of casualties per 1,000 fire incidents is 21. This indicator was the highest - 51 in 2018, and the lowest 4 in 2015. The trend for casualties per 1,000 fires is growing. Compared to the Arkansas value the number of casualties per 1,000 fires is much higher.
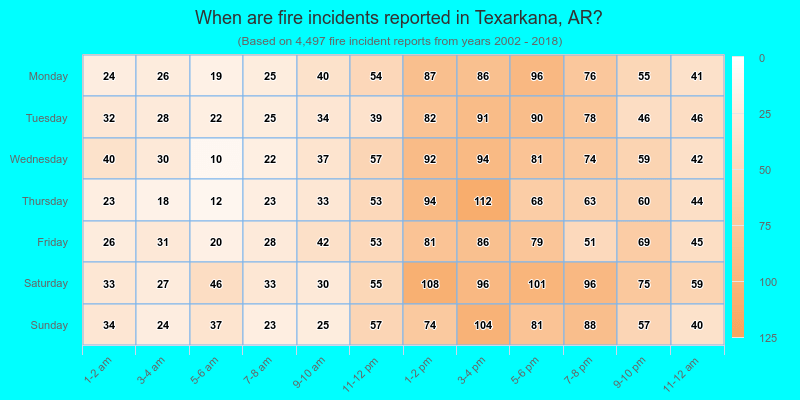
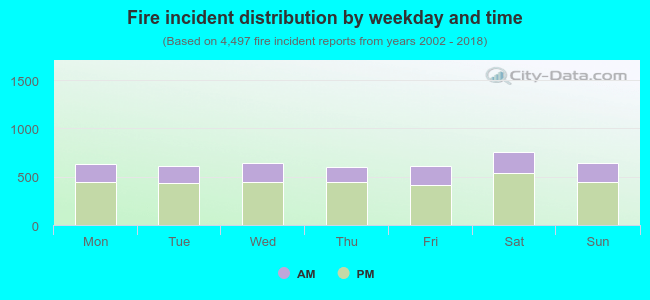 30.0% incidents where reported in the morning and 70.0% in the evening. The most fires (16.9%) took place on Saturday, and the least (13.4%) on Thursday.
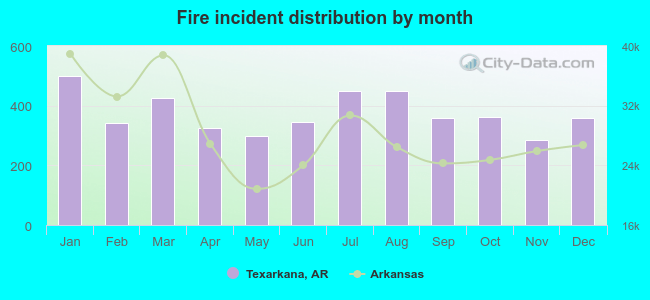 Based on the 4,497 reports from years 2002 - 2018 most fires (11.1%) took place during January, and the least (6.4%) in November.
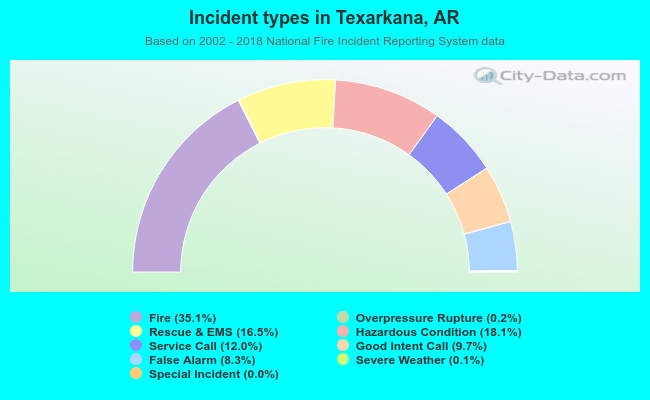 Out of all 12,797 cases reported during the years 2002 - 2018, the most belonged to the categories: Fire (35.1%), Hazardous Condition (18.1%), and Rescue & EMS (16.5%).
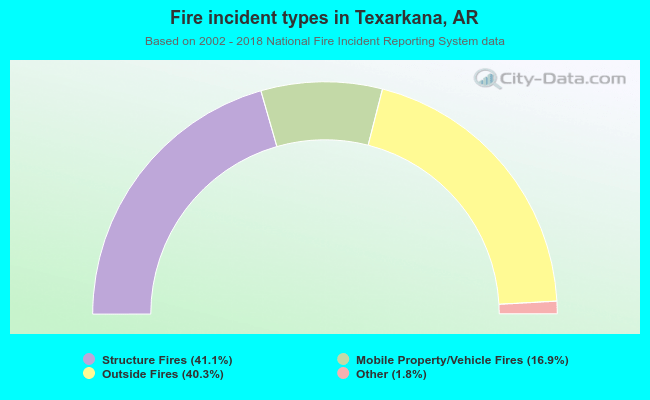 When looking into fire subcategories, the most reports belonged to: Structure Fires (41.1%), and Outside Fires (40.3%).