| Fire incidents reported |
|---|
| Sreet name | Count |
|---|
| 169 HWY | 28 | | CHASE RD ST | 18 | | 169 HWY HWY | 14 | | 80TH RD | 14 | | BROWN RD | 14 | | 70 TH RD RD | 12 | | ANDERSON RD RD | 12 | | JULIA ST | 12 | | 85TH RD | 10 | | BETWEEN 60TTH RD &DOUGLAS | 10 | | DOUGLES RD ST | 10 | | 1000 RD RD | 8 | | 169 HWY @ 20TH RD RDS | 8 | | 47HWY HWY | 8 | | ELK RD | 8 | | WICHITA RD | 8 | | YALE RD | 8 | | 100TH RD RD | 6 | | 1835 85TH RD | 6 | | 60TH RD | 6 | | 6600 RD | 6 | | 6725 FORD RD | 6 | | 90TH RD RD | 6 | | FORD RD RD | 6 | | HARPER RD | 6 |
| | | Fire incidents reported |
|---|
| Sreet name | Count |
|---|
| NEOSHO AVE | 6 | | WILSON ST | 6 | | 1000 RD | 4 | | 100E NEOSHO AVE | 4 | | 10735 N 169 HYW | 4 | | 10735 N HYW 169 | 4 | | 10TH RD RD | 4 | | 120 TH RD RDS | 4 | | 169 & 130TH RD JCT | 4 | | 169 HYW SOUTH | 4 | | 169 HYW100TH RD | 4 | | 20TH RD | 4 | | 2200 80TH RD | 4 | | 27000 RD | 4 | | 47 @ 169 HWY JCT. HWY | 4 | | 47 HWY | 4 | | 47 HWY & BROWN RD | 4 | | 4875 70TH RD | 4 | | 500 RD | 4 | | 60TH RD RD | 4 | | 7595 DORN RD | 4 | | 80 TH @ GRAY RD RDS | 4 | | BROWN RD RDS | 4 | | DORN RD RD | 4 | | |
|
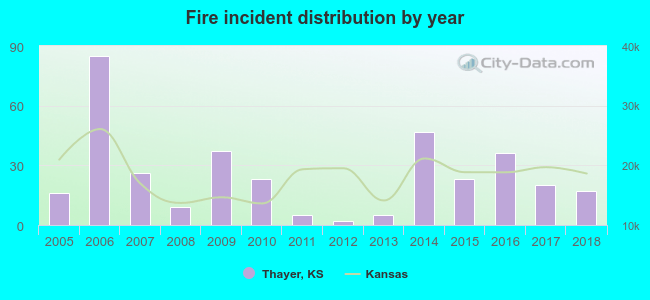 Based on the data from the years 2005 - 2018 the average number of fires per year is 25. The highest number of fires - 85 took place in 2006, and the least - 2 in 2012. The data has a growing trend.
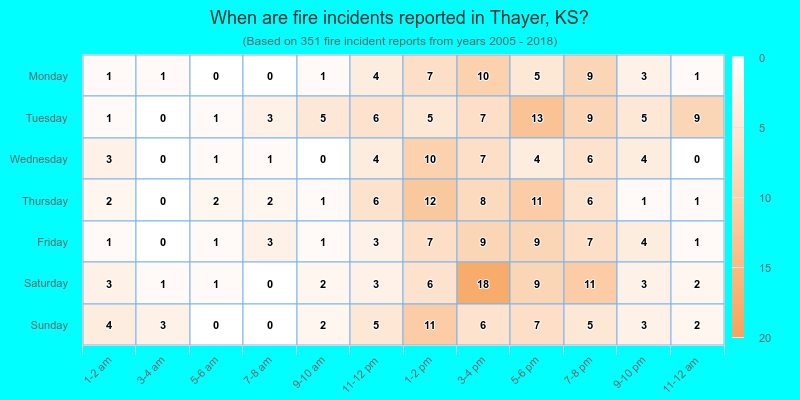
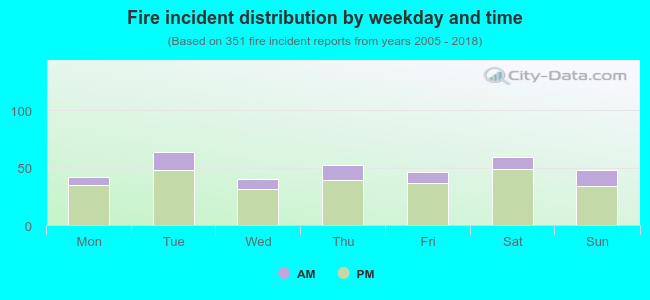 22.2% incidents where reported in the morning and 77.8% in the evening. The most fires (18.2%) took place on Tuesday, and the least (11.4%) on Wednesday.
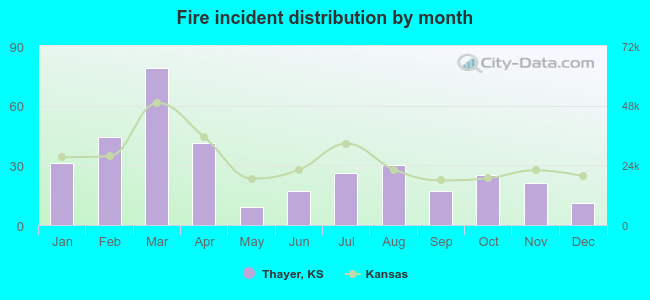 Based on the 351 reports from years 2005 - 2018 most fires (22.5%) took place during March, and the least (2.6%) in May.
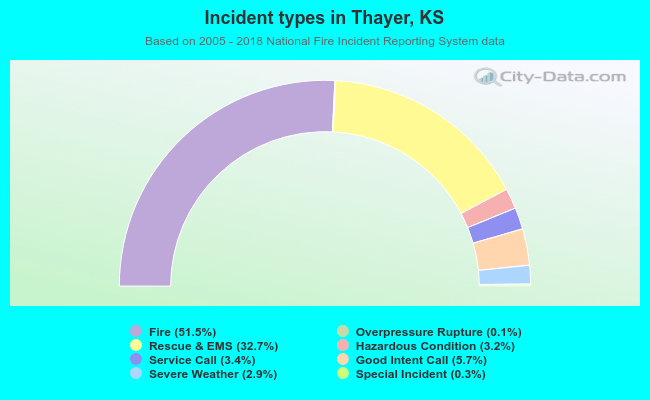 Out of all 681 cases reported during the years 2005 - 2018, the most belonged to the categories: Fire (51.5%), Rescue & EMS (32.7%), and Good Intent Call (5.7%).
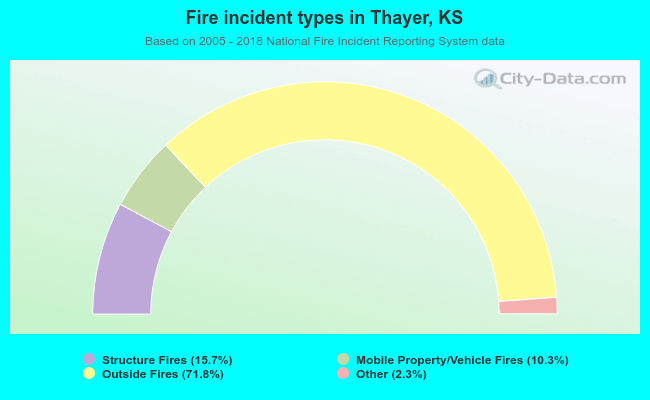 When looking into fire subcategories, the most incidents belonged to: Outside Fires (71.8%), and Structure Fires (15.7%).