The Colony: Fire Incidents, Texas (TX)
Where are fire incidents reported in The Colony, TX
Something went wrong! Please refresh the page.
| Fire incidents reported | |
|---|---|
| Sreet name | Count |
| MAIN ST | 188 |
| COLONY BLVD | 122 |
| SH 121 | 106 |
| MEMORIAL DR | 62 |
| HWY 121 | 60 |
| SQUIRES DR | 34 |
| BAKER DR | 28 |
| BLAIR OAKS DR | 28 |
| LARNER ST | 28 |
| NASH DR | 28 |
| NORTH COLONY BLVD | 28 |
| S.H. 121 HWY | 28 |
| AUGUSTA ST | 26 |
| CHAPMAN ST | 26 |
| SHORE DR | 24 |
| SOUTH COLONY BLVD | 24 |
| PLANO PARKWAY | 22 |
| BOYD RD | 20 |
| BOYD RD RD | 20 |
| BLAIR OAKS | 18 |
| CRAWFORD DR | 18 |
| NEWTON ST | 18 |
| PAIGE RD | 18 |
| STANDRIDGE | 18 |
| CARR ST | 16 |
| RAGAN RD | 16 |
| ARBOR HILLS WAY | 14 |
| BUCCANEER | 14 |
| FRYER ST | 14 |
| MORNING STAR | 14 |
| Other | 330 |
2004 - 2018 National Fire Incident Reporting System (NFIRS) incidents
- Incident types reported to NFIRS in The Colony, TX
- 7,99561.5%Rescue & EMS
- 1,41010.8%Fire
- 1,0267.9%Hazardous Condition
- 9427.2%Service Call
- 9067.0%False Alarm
- 6915.3%Good Intent Call
- 160.1%Overpressure Rupture
- 160.1%Special Incident
- Fire incident types reported to NFIRS in The Colony, TX
- 61243.4%Outside Fires
- 55039.0%Structure Fires
- 20514.5%Mobile Property/Vehicle Fires
- 433.0%Other
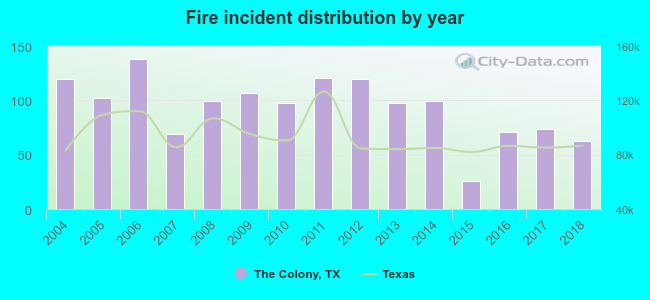 Based on the data from the years 2004 - 2018 the average number of fires per year is 94. The highest number of fires - 138 took place in 2006, and the least - 26 in 2015. The data has a decreasing trend.
The average number of yearly fire incidents per 10k residents in The Colony, TX compared to nearest cities:
(Note: Based on data for the last 3 years, including only cities with population 5,000 and above)
| The Colony: | 16.8 |
| Colony: | 0.2 |
| Frisco: | 17.9 |
| Little Elm: | 33.7 |
| Carrollton: | 24.4 |
| Lewisville: | 27.2 |
| Plano: | 14.4 |
| Lake Dallas: | 36.3 |
| Addison: | 50.9 |
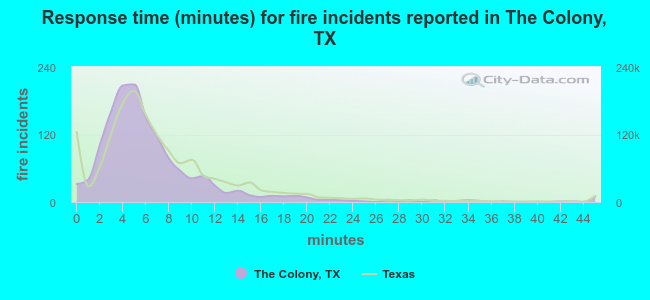 The median response time based on all reported fire incidents is 5 minutes. This is lower than the Texas median value.
The median response time in The Colony, TX compared to nearest cities:
(Note: Based on data for all years, including only cities with at least 500 fire incidents)
| The Colony: | 5 minutes |
| Frisco: | 5 minutes |
| Little Elm: | 7 minutes |
| Carrollton: | 5 minutes |
| Lewisville: | 5 minutes |
| Plano: | 5 minutes |
| Addison: | 5 minutes |
| Highland Village: | 7 minutes |
| Coppell: | 5 minutes |
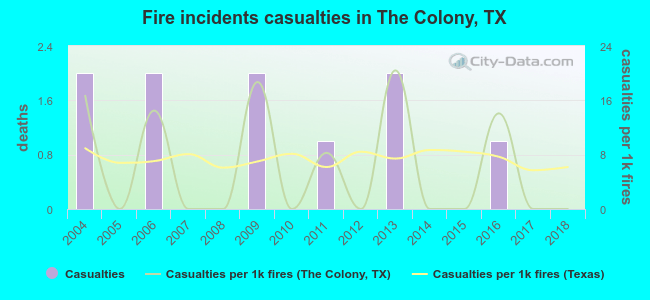 According to the reports from the years 2004 - 2018 the average number of fire-related yearly casualties is 1. The highest number of injuries - 2 took place in 2004, and the lowest - 0 in 2005. The data has a declining trend.
The average number of casualties per 1,000 fire incidents is 6. This indicator was the highest - 20 in 2013, and the lowest 0 in 2005. The trend for injuries per 1,000 fire incidents is dropping. Compared to the state value the number of casualties per 1,000 fires is about the same.
According to the reports from the years 2004 - 2018 the average number of fire-related yearly casualties is 1. The highest number of injuries - 2 took place in 2004, and the lowest - 0 in 2005. The data has a declining trend.
The average number of casualties per 1,000 fire incidents is 6. This indicator was the highest - 20 in 2013, and the lowest 0 in 2005. The trend for injuries per 1,000 fire incidents is dropping. Compared to the state value the number of casualties per 1,000 fires is about the same.Casualties per 1,000 incidents in The Colony, TX compared to nearest cities:
(Note: Based on data for all years, including only cities with at least 500 fire incidents)
| The Colony: | 7.1 |
| Frisco: | 14.0 |
| Little Elm: | 10.0 |
| Carrollton: | 14.1 |
| Lewisville: | 8.1 |
| Plano: | 11.1 |
| Addison: | 4.6 |
| Highland Village: | 0.0 |
| Coppell: | 8.6 |
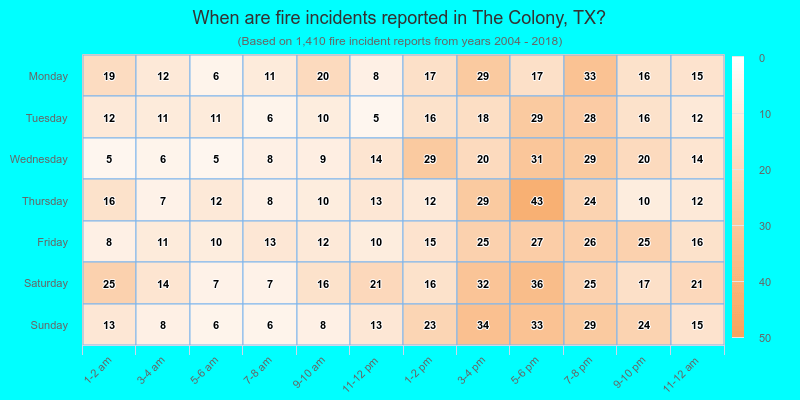
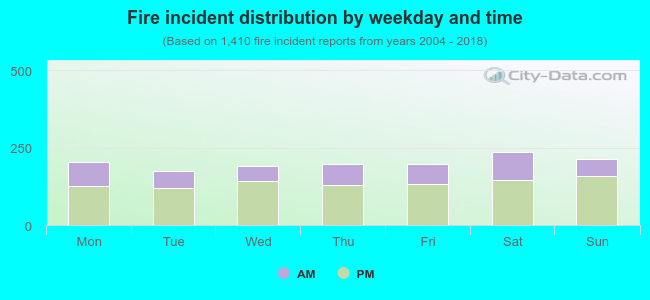 32.1% incidents where reported in the morning and 67.9% in the evening. The most fires (16.8%) took place on Saturday, and the least (12.3%) on Tuesday.
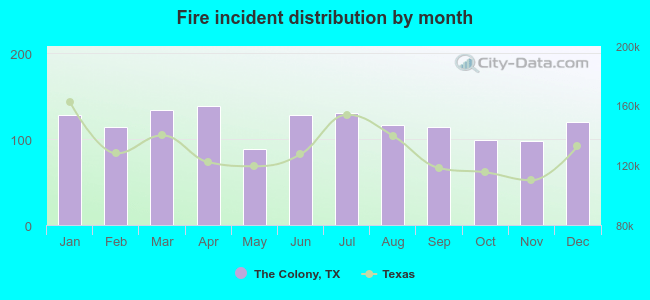 Based on the 1,410 fire incident reports from years 2004 - 2018 most fires (9.9%) took place during April, and the least (6.3%) in May.
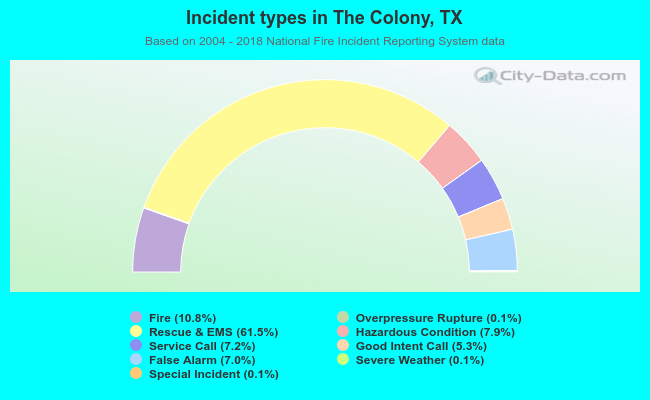 Out of all 13,009 cases reported during the years 2004 - 2018, the most belonged to the categories: Rescue & EMS (61.5%), Fire (10.8%), and Hazardous Condition (7.9%).
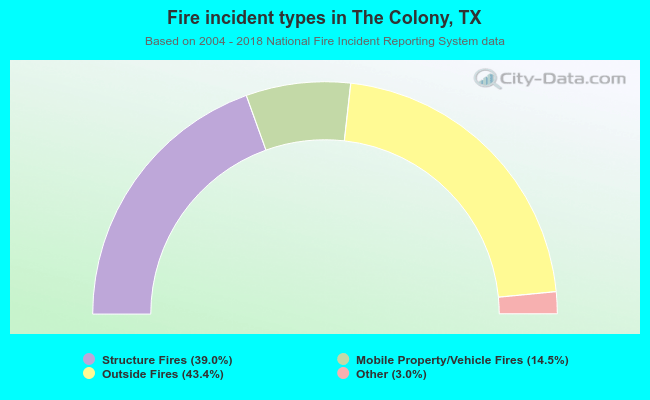 When looking into fire subcategories, the most incidents belonged to: Outside Fires (43.4%), and Structure Fires (39.0%).