Thorntown: Fire Incidents, Indiana (IN)
Where are fire incidents reported in Thorntown, IN
Something went wrong! Please refresh the page.
|
| |||||||||||||||||||||||||||||||||||||||||||||||||||||||||||||||||||||||||||||||||||||||||||||||||||||||||||||
| Other | 123 | |||||||||||||||||||||||||||||||||||||||||||||||||||||||||||||||||||||||||||||||||||||||||||||||||||||||||||||
2002 - 2017 National Fire Incident Reporting System (NFIRS) incidents
- Incident types reported to NFIRS in Thorntown, IN
- 36574.2%Fire
- 5811.8%Rescue & EMS
- 438.7%Hazardous Condition
- 112.2%Good Intent Call
- 71.4%Service Call
- 71.4%False Alarm
- 10.2%Special Incident
- Fire incident types reported to NFIRS in Thorntown, IN
- 17146.8%Outside Fires
- 8824.1%Structure Fires
- 6217.0%Mobile Property/Vehicle Fires
- 4412.1%Other
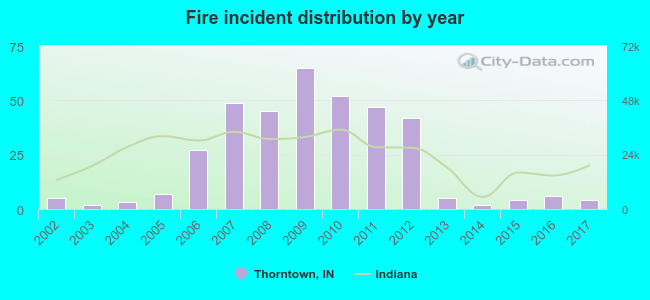 According to the data from the years 2002 - 2017 the average number of fires per year is 23. The highest number of fires - 65 took place in 2009, and the least - 2 in 2003. The data has a dropping trend.
 29.9% incidents where reported in the morning and 70.1% in the evening. The most fires (15.3%) took place on Saturday, and the least (12.9%) on Monday.
 According to the 365 reports from years 2002 - 2017 most fires (15.9%) took place during March, and the least (3.0%) in December.
 Out of all 492 cases reported during the years 2002 - 2017, the most belonged to the categories: Fire (74.2%), Overpressure Rupture (11.8%), and Rescue & EMS (8.7%).
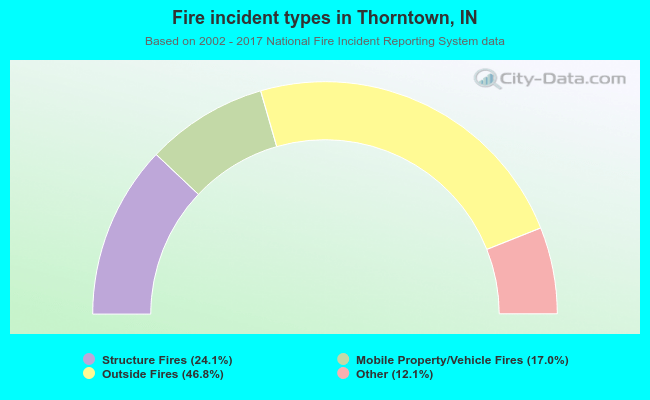 When looking into fire subcategories, the most incidents belonged to: Outside Fires (46.8%), and Structure Fires (24.1%).