| Fire incidents reported |
|---|
| Sreet name | Count |
|---|
| I90 FWY | 108 | | THORP HWY | 56 | | TANEUM RD | 30 | | GOODWIN RD | 16 | | GLADMAR RD | 14 | | I90 | 14 | | MAIN ST | 14 | | I-90 FWY | 10 | | I-90 MP 99 | 8 | | THORP CEMETARY RD | 8 | | WEST TANEUM RD | 8 | | HUNTER RD | 6 | | I90 HWY | 6 | | SR 10 HWY | 6 | | 1ST ST | 4 | | COTTONWOOD RD | 4 | | GOODWYN RD | 4 | | HAYWARD HILL RD | 4 | | HWY 10 | 4 | | I 90 WB MP 100 | 4 | | I-90 MP 97 EB | 4 | | I-90 MP 98 EB | 4 | | I-90 WB HWY | 4 | | SR 10 | 4 | | SR 97 MP 144 | 4 |
| | | Fire incidents reported |
|---|
| Sreet name | Count |
|---|
| THORP PRAIRIE RD | 4 | | 10540 N THORP HWY | 2 | | 11701 SR 10 | 2 | | 11852 SR 10 HWY | 2 | | 1391 TWIN LAKES | 2 | | 2575 THORP CEMETARRY RD | 2 | | 26 GLADMIR RD | 2 | | 270 MISSION RD | 2 | | 2740 MCMANAMY RD | 2 | | 281 GLADMAR RD | 2 | | 281 MISSION RD. | 2 | | 2961 E TANUM RD | 2 | | 2ND ST | 2 | | 33123 N THORP HWY | 2 | | 440 HIGHLINE LOOP | 2 | | 450 EAGLE REST RD | 2 | | 450 MEADOW VIEW DRIVE | 2 | | 50 FIELD STONE CT | 2 | | 511 ROBINSON CANYON | 2 | | 531 NOTCHO LN | 2 | | 611 COVE ROAD | 2 | | 6680 W TANEUM RD | 2 | | 7210 S THORP HWY | 2 | | 790 DUDLEY ROAD | 2 | | |
|
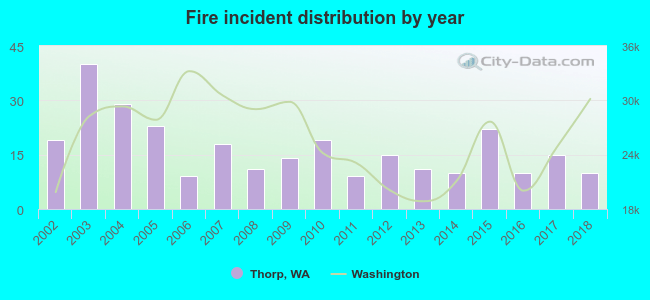 Based on the data from the years 2002 - 2018 the average number of fire incidents per year is 17. The highest number of fires - 40 took place in 2003, and the least - 9 in 2006. The data has a declining trend.
 35.9% incidents where reported in the morning and 64.1% in the evening. The most fires (20.1%) took place on Friday, and the least (9.2%) on Tuesday.
 Based on the 284 fire incidents from years 2002 - 2018 most fires (25.0%) took place during July, and the least (2.5%) in November.
 Out of all 777 cases reported during the years 2002 - 2018, the most belonged to the categories: Overpressure Rupture (38.2%), Fire (36.6%), and Rescue & EMS (7.3%).
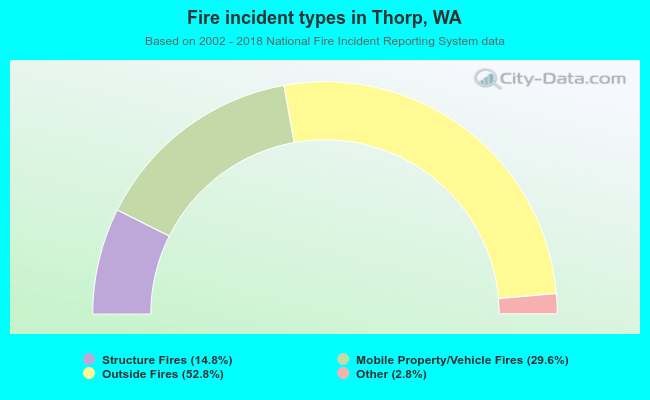 When looking into fire subcategories, the most reports belonged to: Outside Fires (52.8%), and Mobile Property/Vehicle Fires (29.6%).