| Fire incidents reported |
|---|
| Sreet name | Count |
|---|
| U.S. 31 HWY | 40 | | FRANKLIN ST | 38 | | DAKOTA RD | 22 | | COUNTY RD 29 RD | 20 | | COUNTY ROAD 234 | 20 | | COUNTY ROAD 29 | 20 | | COLLINS CHAPEL RD | 15 | | FRANK ST | 15 | | MICHIGAN AVE | 15 | | US HWY 31 | 15 | | COUNTY 29 RD | 14 | | COUNTY 50 RD | 14 | | ELLISON RD | 14 | | JONES ST | 14 | | TUSCALOOSA RD | 14 | | CRUMPTON ST | 13 | | INDIANA AVE | 13 | | CLEVELAND ST | 10 | | COUNTY 213 RD | 10 | | COUNTY ROAD 216 RD | 10 | | INDUSTRIAL DR | 10 | | IOWA AVE | 10 | | LINCOLN ST | 10 | | MEDICAL CENTER DR | 10 | | MONTGOMERY AVE | 10 |
| | | Fire incidents reported |
|---|
| Sreet name | Count |
|---|
| THIRD ST | 10 | | ALABAMA AVE | 9 | | OLD WEST RD | 9 | | 105 NE 219 EXXON | 5 | | 660 COUNTY ROAD 234 ROAD | 5 | | 9125 COUNTY ROAD 29 | 5 | | CO RD 229 RD | 5 | | CO RD 29 RD | 5 | | CO RD 976 | 5 | | COUNTY 13 RD | 5 | | COUNTY 131 RD | 5 | | COUNTY 138 RD | 5 | | COUNTY 153 RD | 5 | | COUNTY 231 RD | 5 | | COUNTY 240 RD | 5 | | COUNTY 402 RD | 5 | | COUNTY 42 RD | 5 | | COUNTY 53 RD | 5 | | COUNTY 55 RD | 5 | | COUNTY 627 RD | 5 | | COUNTY 71 RD | 5 | | COUNTY 744 RD | 5 | | COUNTY 786 RD | 5 | | COUNTY 792 RD | 5 | | COUNTY 856 RD | 5 |
|
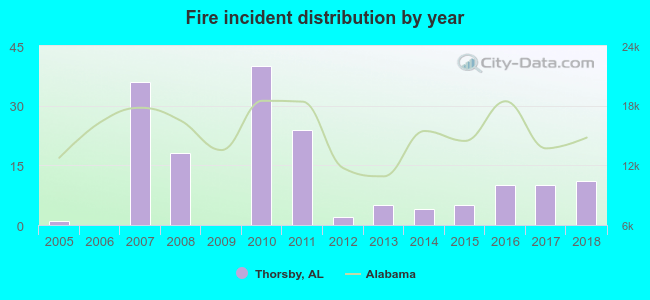 According to the data from the years 2005 - 2018 the average number of fires per year is 12. The highest number of reported fires - 40 took place in 2010, and the least - 0 in 2006. The data has an increasing trend.
 33.1% incidents where reported in the morning and 66.9% in the evening. The most fires (19.3%) took place on Monday, and the least (9.6%) on Sunday.
 Based on the 166 fires from years 2005 - 2018 most fires (16.3%) took place during March, and the least (3.0%) in December.
 Out of all 464 cases reported during the years 2005 - 2018, the most belonged to the categories: Overpressure Rupture (43.8%), Fire (35.8%), and Service Call (9.7%).
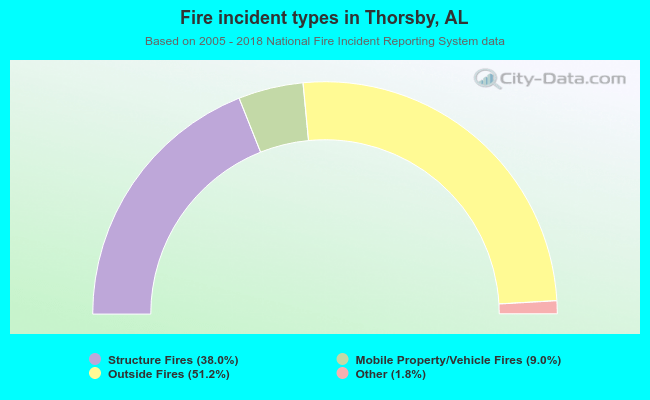 When looking into fire subcategories, the most incidents belonged to: Outside Fires (51.2%), and Structure Fires (38.0%).