Timmonsville: Fire Incidents, South Carolina (SC)
Where are fire incidents reported in Timmonsville, SC
Something went wrong! Please refresh the page.
|
| |||||||||||||||||||||||||||||||||||||||||||||||||||||||||||||||||||||||||||||||||||||||||||||||||||||||||||||
2009 - 2018 National Fire Incident Reporting System (NFIRS) incidents
- Incident types reported to NFIRS in Timmonsville, SC
- 63242.3%Rescue & EMS
- 35323.6%Fire
- 27018.1%Good Intent Call
- 896.0%Hazardous Condition
- 724.8%False Alarm
- 654.4%Service Call
- 110.7%Severe Weather
- Fire incident types reported to NFIRS in Timmonsville, SC
- 15744.5%Outside Fires
- 13638.5%Structure Fires
- 5615.9%Mobile Property/Vehicle Fires
- 41.1%Other
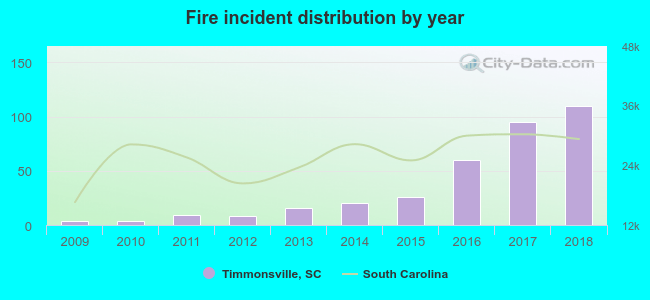 According to the data from the years 2009 - 2018 the average number of fires per year is 35. The highest number of reported fire incidents - 110 took place in 2018, and the least - 4 in 2009. The data has a rising trend.
 27.5% incidents where reported in the morning and 72.5% in the evening. The most fires (16.7%) took place on Saturday, and the least (11.6%) on Friday.
 According to the 353 fire incident reports from years 2009 - 2018 most fires (13.3%) took place during March, and the least (3.1%) in October.
 Out of all 1,494 cases reported during the years 2009 - 2018, the most belonged to the categories: Rescue & EMS (42.3%), Fire (23.6%), and Good Intent Call (18.1%).
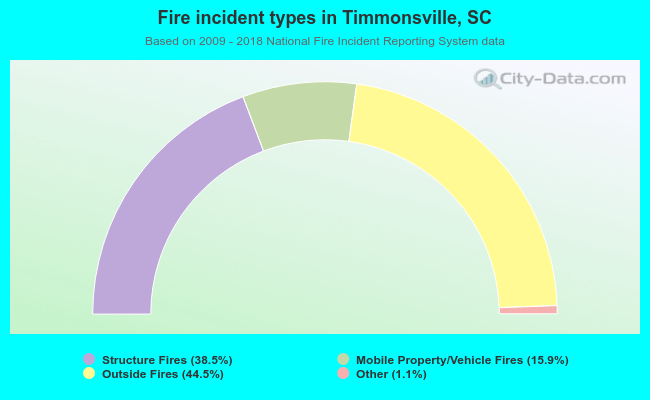 When looking into fire subcategories, the most incidents belonged to: Outside Fires (44.5%), and Structure Fires (38.5%).