Toccoa: Fire Incidents, Georgia (GA)
Where are fire incidents reported in Toccoa, GA
Something went wrong! Please refresh the page.
|
| |||||||||||||||||||||||||||||||||||||||||||||||||||||||||||||||||||||||||||||||||||||||||||||||||||||||||||||
| Other | 416 | |||||||||||||||||||||||||||||||||||||||||||||||||||||||||||||||||||||||||||||||||||||||||||||||||||||||||||||
2003 - 2018 National Fire Incident Reporting System (NFIRS) incidents
- Incident types reported to NFIRS in Toccoa, GA
- 3,03849.3%Rescue & EMS
- 1,28020.8%Fire
- 63710.3%Hazardous Condition
- 4146.7%Good Intent Call
- 4136.7%False Alarm
- 3345.4%Service Call
- 210.3%Overpressure Rupture
- 110.2%Severe Weather
- 110.2%Special Incident
- Fire incident types reported to NFIRS in Toccoa, GA
- 58245.5%Outside Fires
- 48537.9%Structure Fires
- 17813.9%Mobile Property/Vehicle Fires
- 352.7%Other
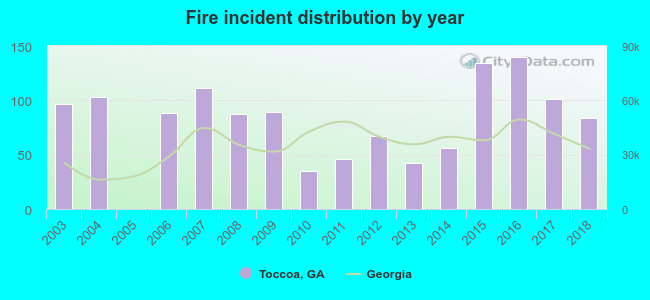 According to the data from the years 2003 - 2018 the average number of fires per year is 80. The highest number of reported fires - 140 took place in 2016, and the least - 0 in 2005. The data has a decreasing trend.
The average number of yearly fire incidents per 10k residents in Toccoa, GA compared to nearest cities:
(Note: Based on data for the last 3 years, including only cities with population 5,000 and above)
| Toccoa: | 131.2 |
| Commerce: | 170.2 |
| Jefferson: | 133.8 |
| Gainesville: | 129.7 |
| Murrayville: | 14.2 |
| Dahlonega: | 165.7 |
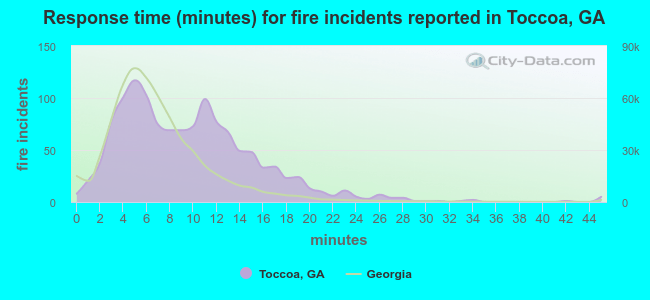 The median response time based on all reported fire incidents is 9 minutes. This is higher than the Georgia median value.
The median response time in Toccoa, GA compared to nearest cities:
(Note: Based on data for all years, including only cities with at least 500 fire incidents)
| Toccoa: | 9 minutes |
| Clarkesville: | 7 minutes |
| Lavonia: | 8 minutes |
| Cleveland: | 9 minutes |
| Commerce: | 9 minutes |
| Hartwell: | 6 minutes |
| Jefferson: | 8 minutes |
| Gainesville: | 6 minutes |
| Hiawassee: | 8 minutes |
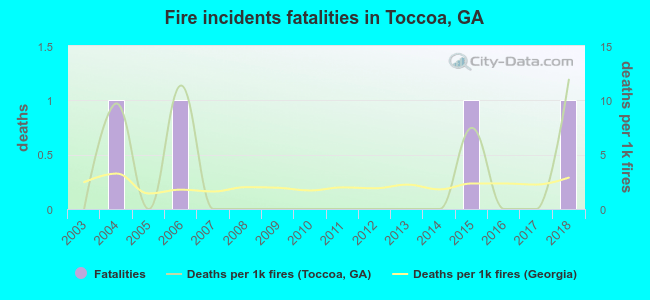 Based on the data from the years 2003 - 2018 the average number of fire-related yearly deaths is 0. The highest number of reported deaths - 1 took place in 2004, and the lowest - 0 in 2003. The data has an increasing trend.
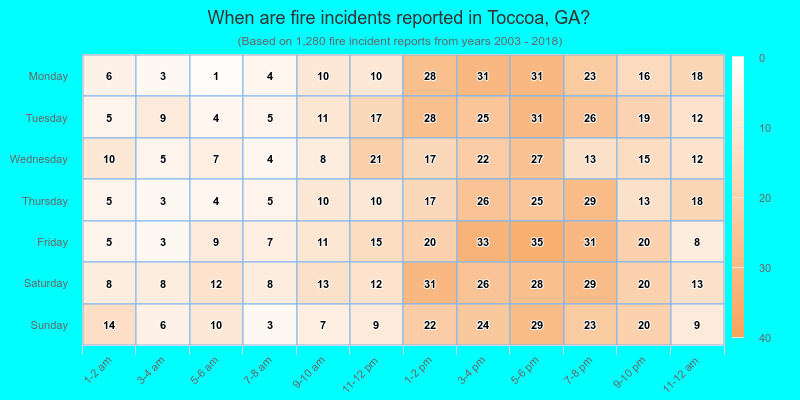
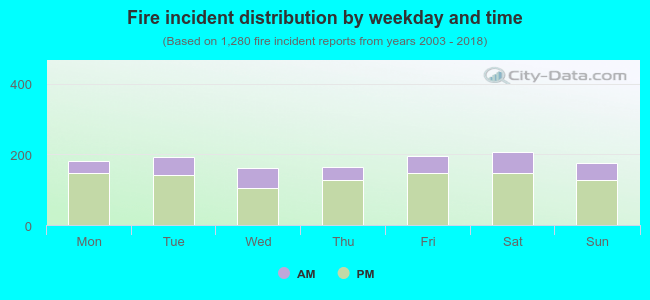 26.3% incidents where reported in the morning and 73.7% in the evening. The most fires (16.3%) took place on Saturday, and the least (12.6%) on Wednesday.
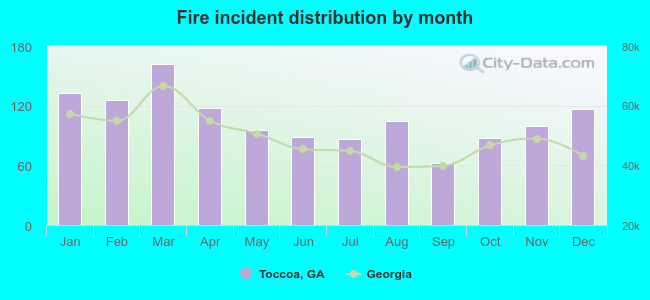 Based on the 1,280 reports from years 2003 - 2018 most fires (12.7%) took place during March, and the least (4.8%) in September.
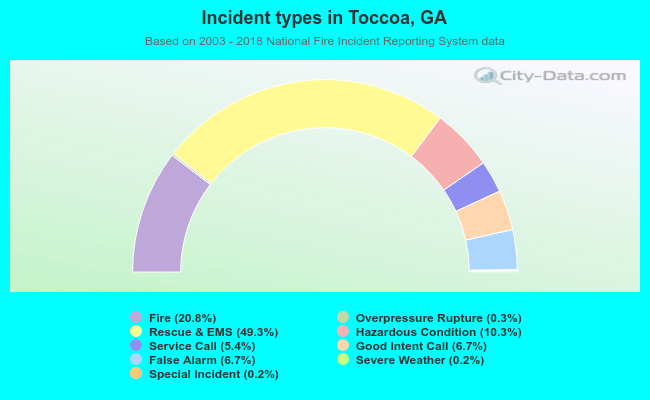 Out of all 6,159 cases reported during the years 2003 - 2018, the most belonged to the categories: Rescue & EMS (49.3%), Fire (20.8%), and Hazardous Condition (10.3%).
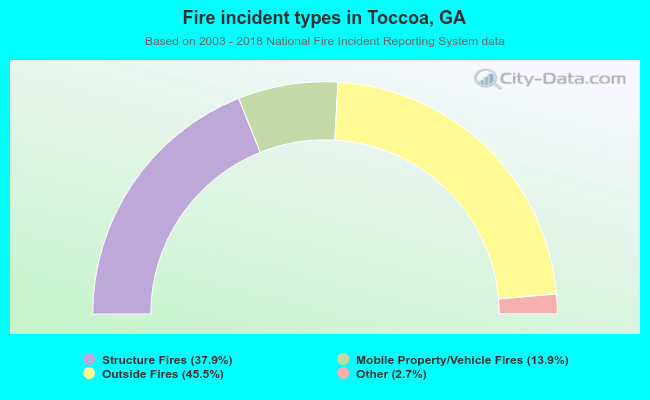 When looking into fire subcategories, the most reports belonged to: Outside Fires (45.5%), and Structure Fires (37.9%).