Tomah: Fire Incidents, Wisconsin (WI)
Where are fire incidents reported in Tomah, WI
Something went wrong! Please refresh the page.
|
| |||||||||||||||||||||||||||||||||||||||||||||||||||||||||||||||||||||||||||||||||||||||||||||||||||||||||||||
2004 - 2018 National Fire Incident Reporting System (NFIRS) incidents
- Incident types reported to NFIRS in Tomah, WI
- 89542.5%Hazardous Condition
- 53325.3%Fire
- 1969.3%False Alarm
- 1959.3%Rescue & EMS
- 1366.5%Service Call
- 1276.0%Good Intent Call
- 150.7%Special Incident
- 80.4%Severe Weather
- Fire incident types reported to NFIRS in Tomah, WI
- 20738.8%Structure Fires
- 17232.3%Outside Fires
- 13325.0%Mobile Property/Vehicle Fires
- 213.9%Other
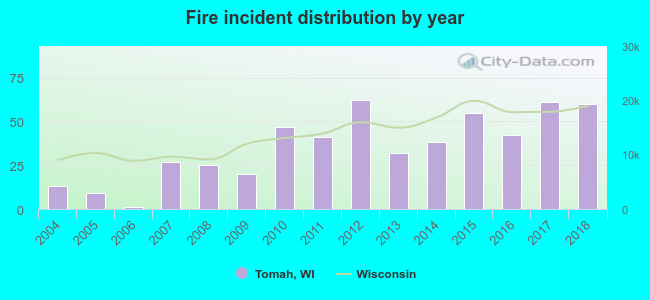 Based on the data from the years 2004 - 2018 the average number of fires per year is 36. The highest number of reported fires - 62 took place in 2012, and the least - 1 in 2006. The data has a growing trend.
The average number of yearly fire incidents per 10k residents in Tomah, WI compared to nearest cities:
(Note: Based on data for the last 3 years, including only cities with population 5,000 and above)
| Tomah: | 58.2 |
| Sparta: | 55.9 |
| West Salem: | 35.3 |
 The median response time based on all reported fire incidents is 9 minutes. This is higher compared to the state median value.
The median response time in Tomah, WI compared to nearest cities:
(Note: Based on data for all years, including only cities with at least 500 fire incidents)
| Tomah: | 9 minutes |
| Sparta: | 10 minutes |
| Black River Falls: | 9 minutes |
 34.9% incidents where reported in the morning and 65.1% in the evening. The most fires (16.7%) took place on Friday, and the least (10.9%) on Thursday.
 Based on the 533 fires from years 2004 - 2018 most fires (12.9%) took place during April, and the least (4.5%) in August.
 Out of all 2,105 cases reported during the years 2004 - 2018, the most belonged to the categories: Rescue & EMS (42.5%), Fire (25.3%), and Good Intent Call (9.3%).
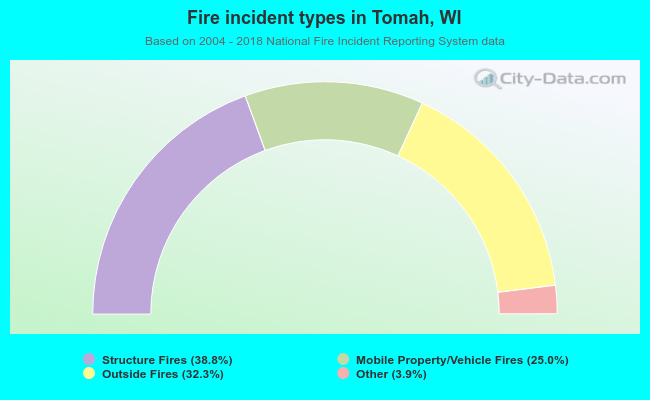 When looking into fire subcategories, the most incidents belonged to: Structure Fires (38.8%), and Outside Fires (32.3%).