Toomsuba: Fire Incidents, Mississippi (MS)
Where are fire incidents reported in Toomsuba, MS
Something went wrong! Please refresh the page.
|
| |||||||||||||||||||||||||||||||||||||||||||||||||||||||||||||||||||||||||||||||||||||||||||||||||||||||||||||
2002 - 2018 National Fire Incident Reporting System (NFIRS) incidents
- Incident types reported to NFIRS in Toomsuba, MS
- 71643.8%Rescue & EMS
- 64239.3%Fire
- 1036.3%Good Intent Call
- 744.5%Hazardous Condition
- 533.2%False Alarm
- 432.6%Service Call
- 30.2%Severe Weather
- Fire incident types reported to NFIRS in Toomsuba, MS
- 32550.6%Outside Fires
- 18428.7%Structure Fires
- 11618.1%Mobile Property/Vehicle Fires
- 172.6%Other
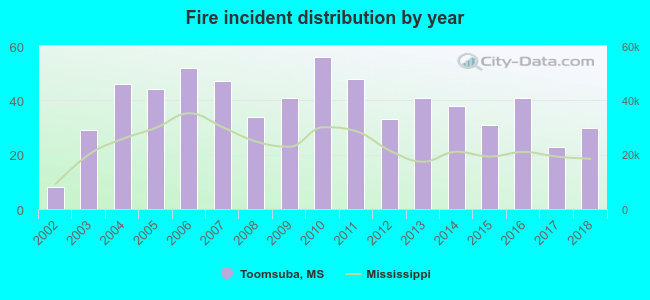 According to the data from the years 2002 - 2018 the average number of fires per year is 38. The highest number of fire incidents - 56 took place in 2010, and the least - 8 in 2002. The data has a growing trend.
 The median response time based on all reported fire incidents is 8 minutes. This is comparable to the Mississippi median value.
The median response time in Toomsuba, MS compared to nearest cities:
(Note: Based on data for all years, including only cities with at least 500 fire incidents)
| Toomsuba: | 8 minutes |
| Lauderdale: | 12 minutes |
| Meridian: | 5 minutes |
| Collinsville: | 8 minutes |
| Quitman: | 8 minutes |
| Decatur: | 8 minutes |
| Union: | 10 minutes |
| Bogue Chitto: | 11 minutes |
| Newton: | 7 minutes |
 28.8% incidents where reported in the morning and 71.2% in the evening. The most fires (16.0%) took place on Thursday, and the least (12.6%) on Sunday.
 Based on the 642 incident reports from years 2002 - 2018 most fires (11.4%) took place during March, and the least (5.5%) in August.
 Out of all 1,635 cases reported during the years 2002 - 2018, the most belonged to the categories: Rescue & EMS (43.8%), Fire (39.3%), and Good Intent Call (6.3%).
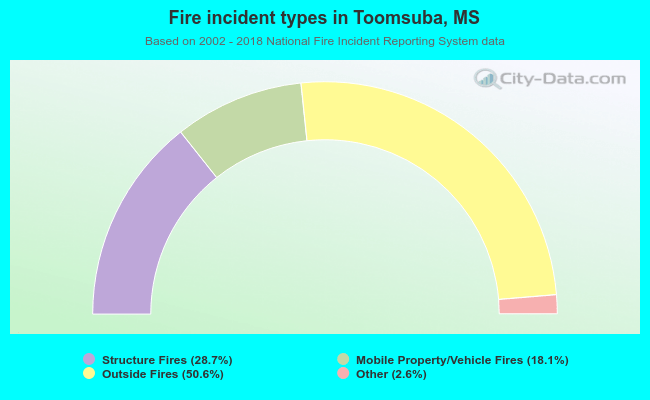 When looking into fire subcategories, the most incidents belonged to: Outside Fires (50.6%), and Structure Fires (28.7%).