| Fire incidents reported |
|---|
| Sreet name | Count |
|---|
| ALAMEDA AVE | 34 | | CIELO DR | 16 | | INTERSTATE 10 FWY | 14 | | O T SMITH RD | 14 | | ALAMEDA | 12 | | VALLE VERDE | 12 | | VALLE VERDE RD | 12 | | DRAKE ST | 8 | | I-10 | 8 | | I10WEST HWY | 8 | | TIERRA DR | 8 | | ALAMEDA (TX-20) HWY | 6 | | COBB AVE | 6 | | FM 1109 | 6 | | HIGHLAND | 6 | | HIGHLAND ST | 6 | | INDIAN HEAD RD | 6 | | ISLAND TORNILLO | 6 | | KNOX ST | 6 | | LINDA DR | 6 | | LOS LETTUNICH RD | 6 | | OIL MILL | 6 | | OT SMITH | 6 | | TIA DR | 6 | | TIERRA | 6 |
| | | Fire incidents reported |
|---|
| Sreet name | Count |
|---|
| TORNILLO AVE | 6 | | ALAMEDA (TX-20) AVE | 4 | | CHAMIZO | 4 | | GABY RD | 4 | | I10EAST HWY | 4 | | INTERSTATE 10 | 4 | | MIDDLE ISLAND RD | 4 | | NEW LIFE DR | 4 | | OIL MILL DR | 4 | | RAILROAD | 4 | | 18971 CIELO DR RD | 2 | | ALAMEDA (TX-20) | 2 | | ALAMEDA AVENUE | 2 | | ALAMEDA DR | 2 | | ALAMEDA SILVERMAN RD AVE | 2 | | ALAMEDA ST | 2 | | ALAMEDA VALLE VERDE AVE | 2 | | ALAMEDA/TX 20 | 2 | | ALAMEDAOT SMITH AVE | 2 | | ALAMO ALTO | 2 | | BIG LIMOSINE | 2 | | COMPA DR | 2 | | COYOTES ST | 2 | | DRAKE | 2 | | FIFTH ST | 2 |
|
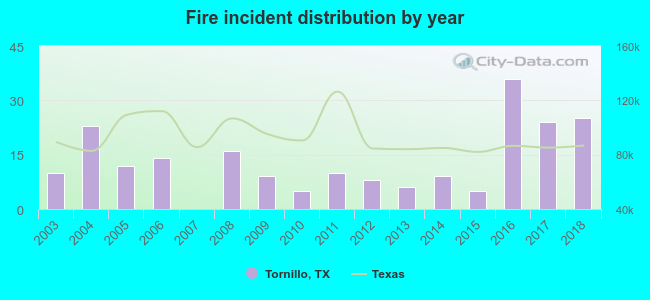 Based on the data from the years 2003 - 2018 the average number of fires per year is 13. The highest number of reported fires - 36 took place in 2016, and the least - 0 in 2007. The data has a rising trend.
 29.2% incidents where reported in the morning and 70.8% in the evening. The most fires (17.9%) took place on Monday, and the least (9.9%) on Saturday.
 Based on the 212 fire incident reports from years 2003 - 2018 most fires (11.8%) took place during April, and the least (4.2%) in September.
 Out of all 1,030 cases reported during the years 2003 - 2018, the most belonged to the categories: Rescue & EMS (66.4%), Fire (20.6%), and Good Intent Call (6.8%).
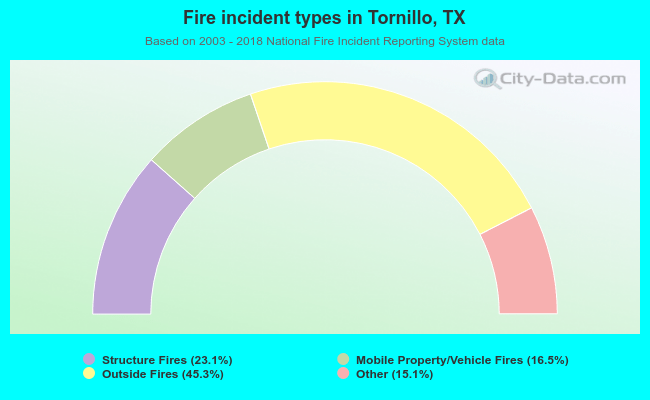 When looking into fire subcategories, the most incidents belonged to: Outside Fires (45.3%), and Structure Fires (23.1%).