| Fire incidents reported |
|---|
| Sreet name | Count |
|---|
| COKE STREET | 22 | | ALTAMONT STREET | 18 | | BEERSHEBA STREET | 16 | | MAIN STREET | 16 | | RUTLEDGE STREET | 14 | | 12TH STREET | 12 | | B MINE ROAD | 12 | | 19TH STREET | 10 | | 3RD STREET | 10 | | 7TH STREET | 10 | | HIGHWAY 56 | 10 | | HILLSIDE CIRCLE | 10 | | BAKER STREET | 8 | | CLOUSE HILL ROAD | 8 | | FIRE TOWER ROAD | 8 | | FLAT BRANCH ROAD | 8 | | JAMES TURNER ROAD | 8 | | PLAIN VIEW LAKE DR | 8 | | RUTHLEDGE STREET | 8 | | SR 56 | 8 | | 10TH STREET | 6 | | 14TH STREET | 6 | | 1ST STREET | 6 | | 349 MONTGOMERY STREET | 6 | | 5TH STREET | 6 |
| | | Fire incidents reported |
|---|
| Sreet name | Count |
|---|
| CLOUDS HILL RD | 6 | | HOBBS HILL ROAD | 6 | | PARTIN FARM ROAD | 6 | | PHIPPS ROAD | 6 | | RAILROAD AVE | 6 | | SHOOK STREET | 6 | | TIPPLE ROAD | 6 | | 12 TH STREET | 4 | | 1644 TIPPLE ROAD | 4 | | 1668 TIPPLE ROAD | 4 | | 17TH STREET | 4 | | 20 TH STREET | 4 | | 2028 FREEMONT ROAD | 4 | | 20TH STREET | 4 | | 253 1ST STREET | 4 | | 2822 TIPPLE ROAD | 4 | | 297 10TH ST | 4 | | 36 PHIPPS ROAD | 4 | | 3922 SR 56 | 4 | | 450 RUTLEDGE STREET | 4 | | 4683 SR 56 | 4 | | 4715 SR 56 | 4 | | 51 RAILROAD AVE. | 4 | | 601 MYERS HILL ROAD | 4 | | 811 PHIPPS ROAD | 4 |
|
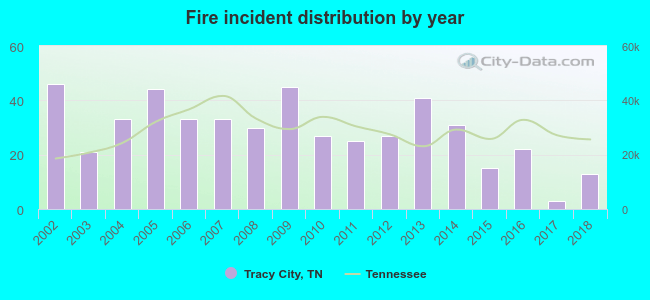 Based on the data from the years 2002 - 2018 the average number of fires per year is 29. The highest number of fire incidents - 46 took place in 2002, and the least - 3 in 2017. The data has a dropping trend.
 34.6% incidents where reported in the morning and 65.4% in the evening. The most fires (19.2%) took place on Sunday, and the least (8.0%) on Friday.
 According to the 489 fires from years 2002 - 2018 most fires (13.5%) took place during March, and the least (5.7%) in June.
 Out of all 624 cases reported during the years 2002 - 2018, the most belonged to the categories: Fire (78.4%), Overpressure Rupture (6.7%), and Rescue & EMS (5.1%).
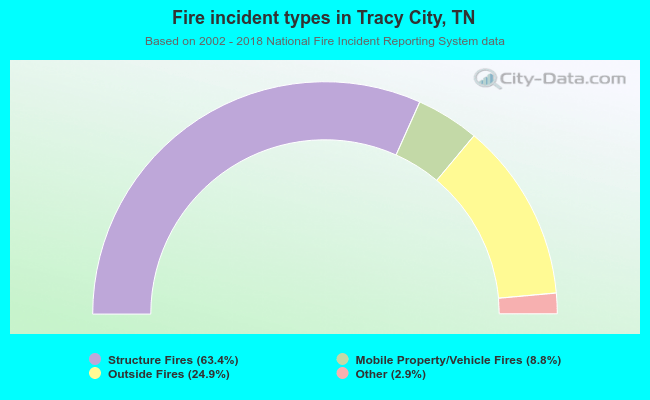 When looking into fire subcategories, the most reports belonged to: Structure Fires (63.4%), and Outside Fires (24.9%).