Trafalgar: Fire Incidents, Indiana (IN)
Where are fire incidents reported in Trafalgar, IN
Something went wrong! Please refresh the page.
|
| |||||||||||||||||||||||||||||||||||||||||||||||||||||||||||||||||||||||||||||||||||||||||||||||||||||||||||||
2002 - 2017 National Fire Incident Reporting System (NFIRS) incidents
- Incident types reported to NFIRS in Trafalgar, IN
- 73351.3%Rescue & EMS
- 36225.4%Fire
- 17712.4%Good Intent Call
- 765.3%Hazardous Condition
- 553.9%Service Call
- 141.0%False Alarm
- 50.4%Special Incident
- 40.3%Severe Weather
- 20.1%Overpressure Rupture
- Fire incident types reported to NFIRS in Trafalgar, IN
- 15643.1%Outside Fires
- 15342.3%Structure Fires
- 339.1%Other
- 205.5%Mobile Property/Vehicle Fires
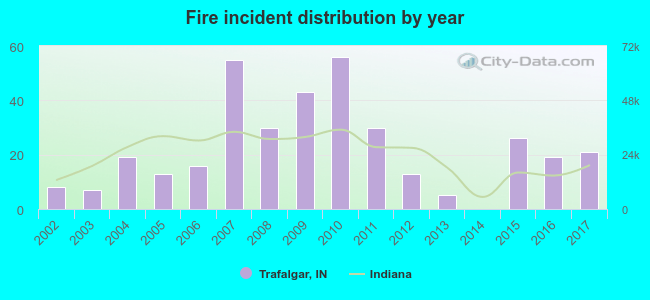 According to the data from the years 2002 - 2017 the average number of fire incidents per year is 23. The highest number of reported fires - 56 took place in 2010, and the least - 0 in 2014. The data has a growing trend.
 29.6% incidents where reported in the morning and 70.4% in the evening. The most fires (16.3%) took place on Friday, and the least (11.6%) on Sunday.
 According to the 362 fire incidents from years 2002 - 2017 most fires (15.2%) took place during March, and the least (4.1%) in May.
 Out of all 1,428 cases reported during the years 2002 - 2017, the most belonged to the categories: Rescue & EMS (51.3%), Fire (25.4%), and Good Intent Call (12.4%).
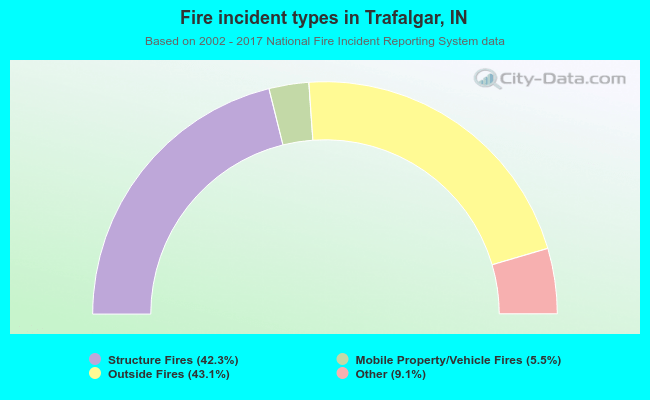 When looking into fire subcategories, the most incidents belonged to: Outside Fires (43.1%), and Structure Fires (42.3%).