Treasure Island: Fire Incidents, Florida (FL)
Where are fire incidents reported in Treasure Island, FL
Something went wrong! Please refresh the page.
|
| |||||||||||||||||||||||||||||||||||||||||||||||||||||||||||||||||||||||||||||||||||||||||||||||||||||||||||||
2005 - 2018 National Fire Incident Reporting System (NFIRS) incidents
- Incident types reported to NFIRS in Treasure Island, FL
- 4,99571.1%Rescue & EMS
- 87012.4%Good Intent Call
- 4246.0%Fire
- 3334.7%Hazardous Condition
- 3104.4%False Alarm
- 741.1%Service Call
- 110.2%Overpressure Rupture
- Fire incident types reported to NFIRS in Treasure Island, FL
- 27063.7%Structure Fires
- 7918.6%Outside Fires
- 409.4%Other
- 358.3%Mobile Property/Vehicle Fires
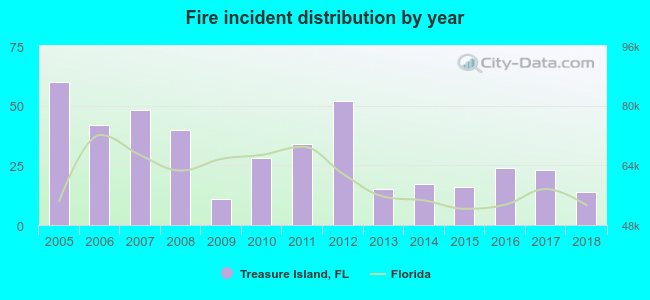 According to the data from the years 2005 - 2018 the average number of fires per year is 30. The highest number of fire incidents - 60 took place in 2005, and the least - 11 in 2009. The data has a decreasing trend.
The average number of yearly fire incidents per 10k residents in Treasure Island, FL compared to nearest cities:
(Note: Based on data for the last 3 years, including only cities with population 5,000 and above)
| Treasure Island: | 29.9 |
| South Pasadena: | 29.1 |
| Gulfport: | 23.5 |
| Kenneth City: | 6.6 |
| Seminole: | 58.6 |
| Lealman: | 15.8 |
| Pinellas Park: | 38.7 |
| Largo: | 32.8 |
| Clearwater: | 44.1 |
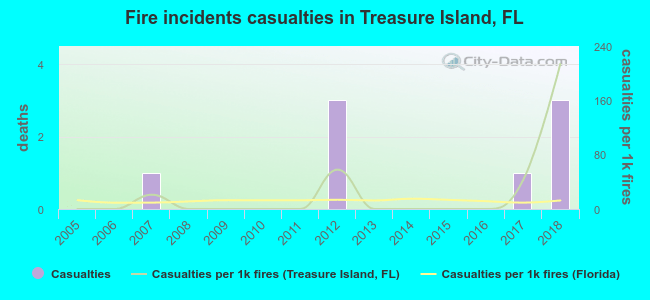 According to the reports from the years 2005 - 2018 the average number of fire-related yearly casualties is 1. The highest number of casualties - 3 took place in 2012, and the lowest - 0 in 2005. The data has a growing trend.
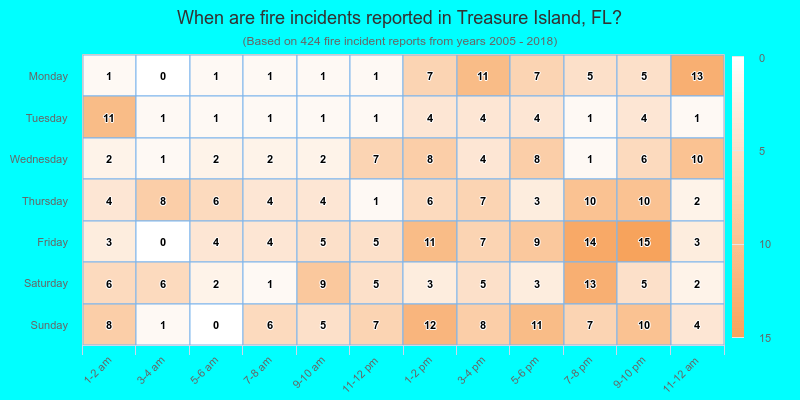
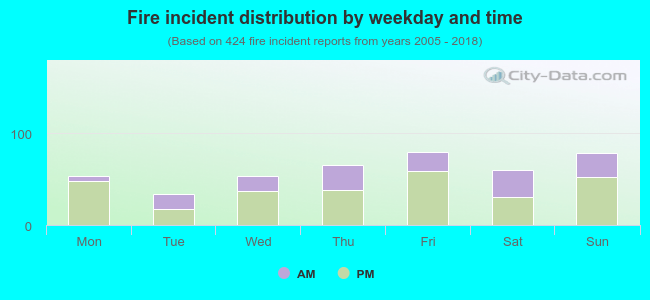 33.3% incidents where reported in the morning and 66.7% in the evening. The most fires (18.9%) took place on Friday, and the least (8.0%) on Tuesday.
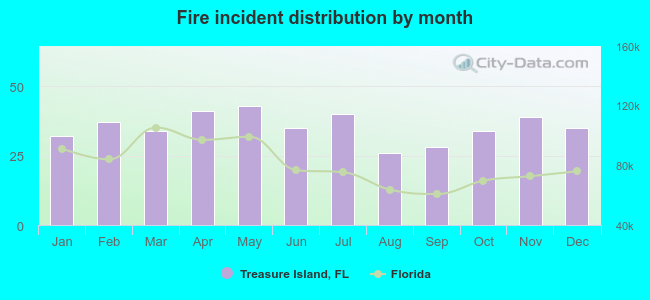 According to the 424 incident reports from years 2005 - 2018 most fires (10.1%) took place during May, and the least (6.1%) in August.
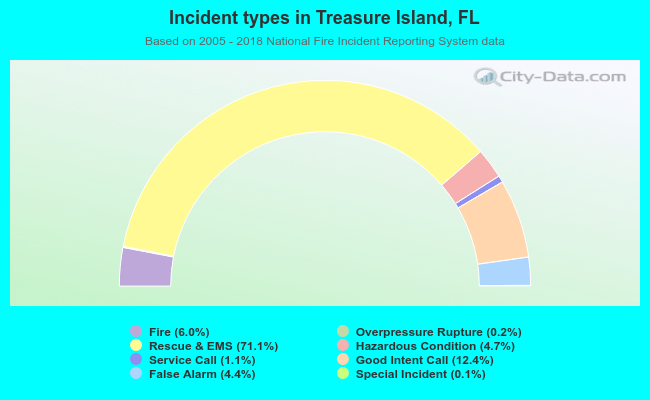 Out of all 7,021 cases reported during the years 2005 - 2018, the most belonged to the categories: Rescue & EMS (71.1%), Good Intent Call (12.4%), and Fire (6.0%).
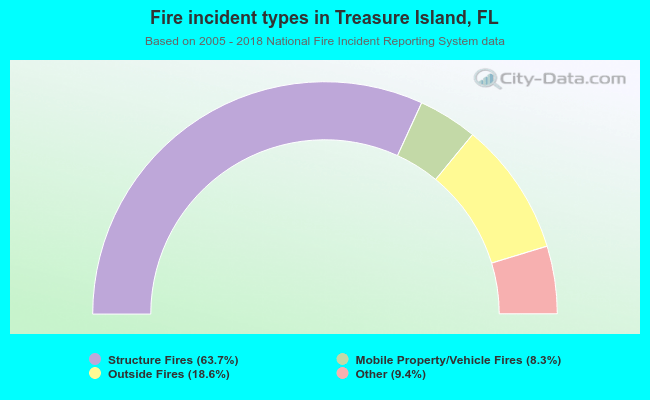 When looking into fire subcategories, the most reports belonged to: Structure Fires (63.7%), and Outside Fires (18.6%).