| Fire incidents reported |
|---|
| Sreet name | Count |
|---|
| HIGHWAY 121 | 16 | | CR 4455 | 12 | | SH 121 | 10 | | CR 4515 | 8 | | CR 4915 | 8 | | HIGHWAY 69 | 8 | | SAUNDERS | 8 | | CR 4465 | 6 | | CR 4536 | 6 | | CR 4605 | 6 | | HWY 121 | 6 | | HWY 69 | 6 | | PEARL ST | 6 | | CR 4446 | 4 | | CR 4465 RD | 4 | | CR 4545 | 4 | | CR 4641 | 4 | | FM 151 | 4 | | FM 815 | 4 | | HIGHWAY 78 | 4 | | HWY 78 | 4 | | JACK ENGLAND RD. | 4 | | PRIVATE ROAD 450 | 4 | | SH 69 | 4 | | STATE HWY 121 | 4 |
| | | Fire incidents reported |
|---|
| Sreet name | Count |
|---|
| TAMALE ROAD | 4 | | 10485 S HWY 121 | 2 | | 109 PECAN CIRCLE | 2 | | 11277 HWY 121 SOUTH | 2 | | 1137 CR 4900 | 2 | | 121 AND HWY 69 | 2 | | 121 PR 451 | 2 | | 121 SOUTH OF TRENTON | 2 | | 240 CR 4610 | 2 | | 295 CR 4900 | 2 | | 2ND AND ROBINSON ST | 2 | | 300 AGUSTIUS STREET | 2 | | 300 AGUSTUS ST | 2 | | 304 SOUTH PEARL STREET | 2 | | 305 N 3RD STREET | 2 | | 402 SOUTH PEARL ST | 2 | | 408 CR 4415 | 2 | | 501 SAUNDERS ST | 2 | | 6690 HWY 69 | 2 | | 69 AND CR4905 | 2 | | 692 CR 4534 | 2 | | 712 AGUSTUS STREET | 2 | | 814 W SANDERS | 2 | | AUGUSTA ST. | 2 | | |
|
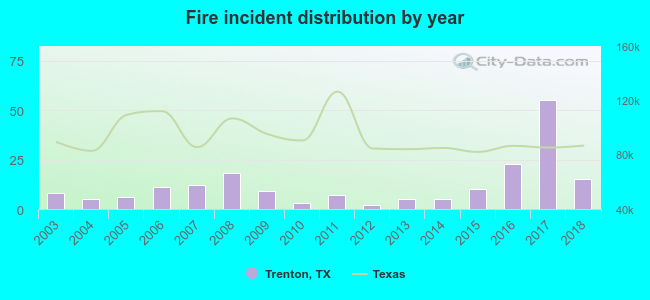 Based on the data from the years 2003 - 2018 the average number of fires per year is 12. The highest number of reported fires - 55 took place in 2017, and the least - 2 in 2012. The data has a rising trend.
 31.4% incidents where reported in the morning and 68.6% in the evening. The most fires (18.6%) took place on Friday, and the least (9.8%) on Saturday.
 Based on the 194 fire incident reports from years 2003 - 2018 most fires (15.5%) took place during July, and the least (3.6%) in April.
 Out of all 616 cases reported during the years 2003 - 2018, the most belonged to the categories: Overpressure Rupture (54.7%), Fire (31.5%), and Hazardous Condition (4.9%).
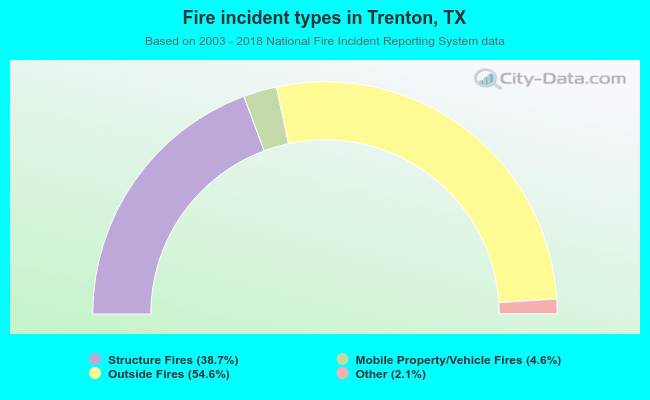 When looking into fire subcategories, the most incidents belonged to: Outside Fires (54.6%), and Structure Fires (38.7%).