Tribes Hill: Fire Incidents, New York (NY)
Where are fire incidents reported in Tribes Hill, NY
Something went wrong! Please refresh the page.
|
| |||||||||||||||||||||||||||||||||||||||||||||||||||||||||||||||||||||||||||||||||||||||||||||||||||||||||||||
2002 - 2018 National Fire Incident Reporting System (NFIRS) incidents
- Incident types reported to NFIRS in Tribes Hill, NY
- 48654.2%Rescue & EMS
- 13214.7%Fire
- 9911.0%Hazardous Condition
- 697.7%Good Intent Call
- 566.3%False Alarm
- 475.2%Service Call
- 70.8%Severe Weather
- Fire incident types reported to NFIRS in Tribes Hill, NY
- 6448.5%Structure Fires
- 2720.5%Outside Fires
- 2115.9%Other
- 2015.2%Mobile Property/Vehicle Fires
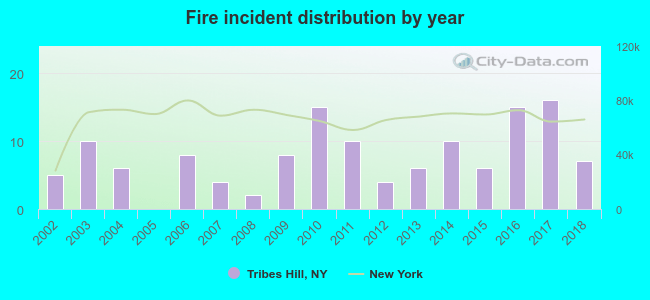 Based on the data from the years 2002 - 2018 the average number of fire incidents per year is 8. The highest number of reported fire incidents - 16 took place in 2017, and the least - 0 in 2005. The data has an increasing trend.
 31.1% incidents where reported in the morning and 68.9% in the evening. The most fires (17.4%) took place on Wednesday, and the least (9.1%) on Tuesday.
 According to the 132 reports from years 2002 - 2018 most fires (12.1%) took place during August, and the least (4.5%) in January.
 Out of all 896 cases reported during the years 2002 - 2018, the most belonged to the categories: Overpressure Rupture (54.2%), Fire (14.7%), and Rescue & EMS (11.0%).
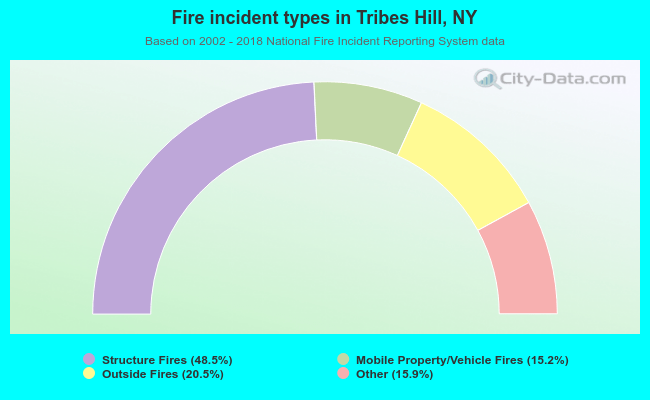 When looking into fire subcategories, the most reports belonged to: Structure Fires (48.5%), and Outside Fires (20.5%).