Trinidad: Fire Incidents, Texas (TX)
Where are fire incidents reported in Trinidad, TX
Something went wrong! Please refresh the page.
|
| |||||||||||||||||||||||||||||||||||||||||||||||||||||||||||||||||||||||||||||||||||||||||||||||||||||||||||||
2002 - 2018 National Fire Incident Reporting System (NFIRS) incidents
- Incident types reported to NFIRS in Trinidad, TX
- 86244.4%Rescue & EMS
- 73037.6%Fire
- 1236.3%Hazardous Condition
- 854.4%Good Intent Call
- 713.7%False Alarm
- 512.6%Service Call
- 191.0%Severe Weather
- Fire incident types reported to NFIRS in Trinidad, TX
- 50168.6%Outside Fires
- 16422.5%Structure Fires
- 446.0%Mobile Property/Vehicle Fires
- 212.9%Other
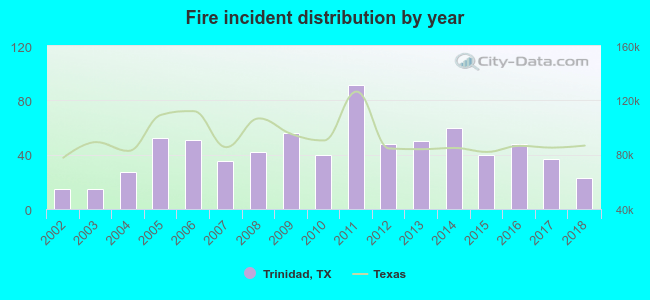 Based on the data from the years 2002 - 2018 the average number of fires per year is 43. The highest number of reported fires - 91 took place in 2011, and the least - 15 in 2002. The data has a rising trend.
 The median response time based on all reported fire incidents is 5 minutes. This is lower compared to the state median value.
The median response time in Trinidad, TX compared to nearest cities:
(Note: Based on data for all years, including only cities with at least 500 fire incidents)
| Trinidad: | 5 minutes |
| Malakoff: | 10 minutes |
| Kerens: | 13 minutes |
| Payne Springs: | 10 minutes |
| Tool: | 9 minutes |
| Eustace: | 10 minutes |
| Gun Barrel City: | 6 minutes |
| Athens: | 7 minutes |
| Seven Points: | 10 minutes |
 24.7% incidents where reported in the morning and 75.3% in the evening. The most fires (15.9%) took place on Wednesday, and the least (10.5%) on Monday.
 Based on the 730 incident reports from years 2002 - 2018 most fires (12.3%) took place during August, and the least (4.0%) in November.
 Out of all 1,943 cases reported during the years 2002 - 2018, the most belonged to the categories: Rescue & EMS (44.4%), Fire (37.6%), and Hazardous Condition (6.3%).
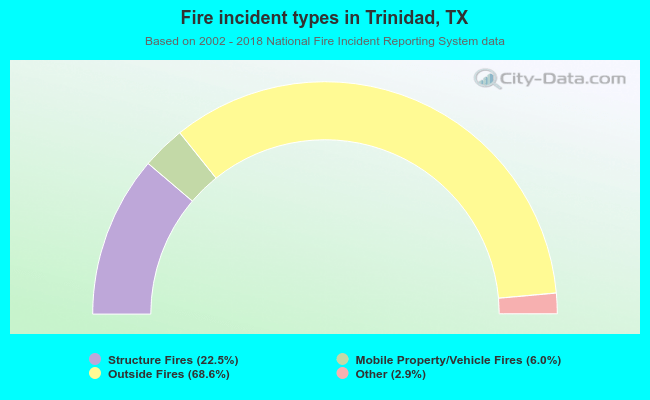 When looking into fire subcategories, the most incidents belonged to: Outside Fires (68.6%), and Structure Fires (22.5%).