Tye: Fire Incidents, Texas (TX)
Where are fire incidents reported in Tye, TX
Something went wrong! Please refresh the page.
|
| |||||||||||||||||||||||||||||||||||||||||||||||||||||||||||||||||||||||||||||||||||||||||||||||||||||||||||||
| Other | 29 | |||||||||||||||||||||||||||||||||||||||||||||||||||||||||||||||||||||||||||||||||||||||||||||||||||||||||||||
2002 - 2018 National Fire Incident Reporting System (NFIRS) incidents
- Incident types reported to NFIRS in Tye, TX
- 36552.3%Fire
- 20329.1%Rescue & EMS
- 608.6%Good Intent Call
- 557.9%Hazardous Condition
- 50.7%Service Call
- 50.7%Severe Weather
- 40.6%False Alarm
- 10.1%Special Incident
- Fire incident types reported to NFIRS in Tye, TX
- 19352.9%Outside Fires
- 12032.9%Structure Fires
- 4311.8%Mobile Property/Vehicle Fires
- 92.5%Other
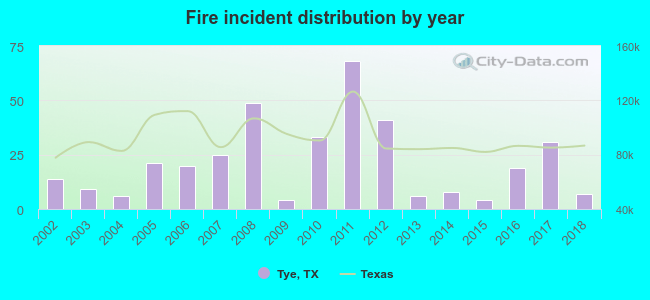 According to the data from the years 2002 - 2018 the average number of fire incidents per year is 21. The highest number of fire incidents - 68 took place in 2011, and the least - 4 in 2009. The data has a declining trend.
 According to the reports from the years 2002 - 2018 the average number of fire-related casualties per year is 0. The highest number of casualties - 3 took place in 2007, and the lowest - 0 in 2002. The data has a constant trend.
 27.1% incidents where reported in the morning and 72.9% in the evening. The most fires (17.3%) took place on Wednesday, and the least (10.4%) on Sunday.
 According to the 365 fire incidents from years 2002 - 2018 most fires (11.0%) took place during June, and the least (4.4%) in November.
 Out of all 698 cases reported during the years 2002 - 2018, the most belonged to the categories: Fire (52.3%), Overpressure Rupture (29.1%), and Service Call (8.6%).
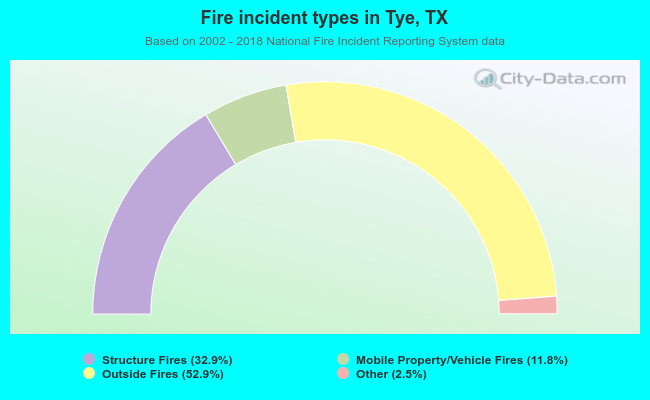 When looking into fire subcategories, the most incidents belonged to: Outside Fires (52.9%), and Structure Fires (32.9%).