Tylertown: Fire Incidents, Mississippi (MS)
Where are fire incidents reported in Tylertown, MS
Something went wrong! Please refresh the page.
|
| |||||||||||||||||||||||||||||||||||||||||||||||||||||||||||||||||||||||||||||||||||||||||||||||||||||||||||||
| Other | 1,098 | |||||||||||||||||||||||||||||||||||||||||||||||||||||||||||||||||||||||||||||||||||||||||||||||||||||||||||||
2003 - 2018 National Fire Incident Reporting System (NFIRS) incidents
- Incident types reported to NFIRS in Tylertown, MS
- 1,90681.2%Fire
- 2289.7%Rescue & EMS
- 1044.4%Good Intent Call
- 582.5%Service Call
- 261.1%Hazardous Condition
- 150.6%False Alarm
- 40.2%Severe Weather
- 40.2%Special Incident
- Fire incident types reported to NFIRS in Tylertown, MS
- 1,09357.3%Outside Fires
- 50726.6%Structure Fires
- 22211.6%Mobile Property/Vehicle Fires
- 844.4%Other
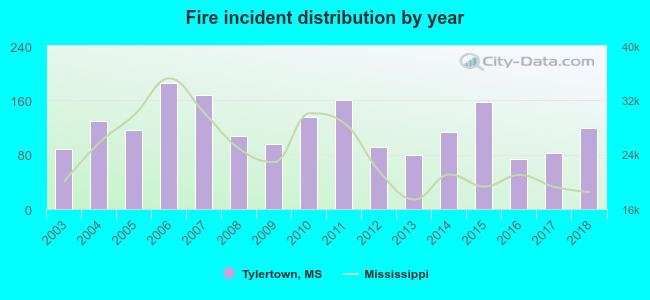 According to the data from the years 2003 - 2018 the average number of fire incidents per year is 119. The highest number of fires - 186 took place in 2006, and the least - 73 in 2016. The data has a rising trend.
 The median response time based on all reported fire incidents is 9 minutes. This is higher than the Mississippi median value.
The median response time in Tylertown, MS compared to nearest cities:
(Note: Based on data for all years, including only cities with at least 500 fire incidents)
| Tylertown: | 9 minutes |
| Foxworth: | 10 minutes |
| Franklinton: | 7 minutes |
| Magnolia: | 9 minutes |
| McComb: | 4 minutes |
| Osyka: | 11 minutes |
| Columbia: | 9 minutes |
| Summit: | 7 minutes |
| Kentwood: | 8 minutes |
 According to the reports from the years 2003 - 2018 the average number of fire-related yearly deaths is 0. The highest number of reported deaths - 2 took place in 2013, and the lowest - 0 in 2003. The data has a constant trend.
 28.2% incidents where reported in the morning and 71.8% in the evening. The most fires (15.8%) took place on Saturday, and the least (12.1%) on Wednesday.
 Based on the 1,906 fire incident reports from years 2003 - 2018 most fires (13.7%) took place during March, and the least (4.9%) in May.
 Out of all 2,346 cases reported during the years 2003 - 2018, the most belonged to the categories: Fire (81.2%), Rescue & EMS (9.7%), and Good Intent Call (4.4%).
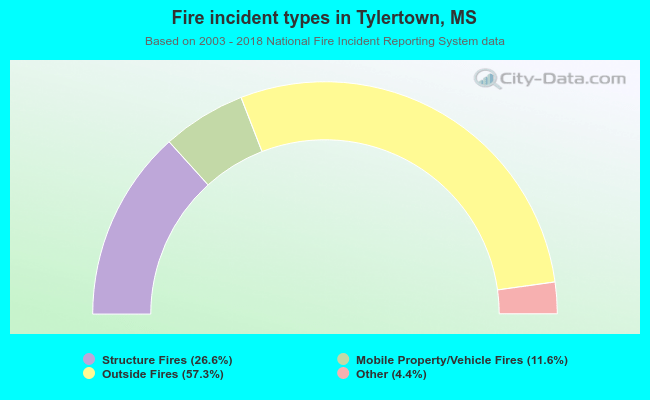 When looking into fire subcategories, the most incidents belonged to: Outside Fires (57.3%), and Structure Fires (26.6%).