Union City: Fire Incidents, California (CA)
Where are fire incidents reported in Union City, CA
Something went wrong! Please refresh the page.
| Fire incidents reported | |
|---|---|
| Sreet name | Count |
| ALVARADO NILES RD | 50 |
| ALVARADO NILES RD | 50 |
| DECOTO RD | 50 |
| ALVARADO | 48 |
| DYER ST | 44 |
| WHIPPLE RD | 42 |
| WHIPPLE RD | 34 |
| UNION CITY BL | 24 |
| UNION SQ | 24 |
| MISSION BL | 22 |
| 11TH ST | 14 |
| 13TH ST | 14 |
| H ST | 14 |
| 7TH ST | 12 |
| 9TH ST | 12 |
| DECOTO RD | 12 |
| DYER ST | 12 |
| 11TH ST | 10 |
| 7TH ST | 10 |
| I880 | 10 |
| INDUSTRIAL | 10 |
| MISSION | 10 |
| MISSION BL | 10 |
| PERRY RD | 10 |
| SKYLARK DR | 10 |
| UNION CITY | 10 |
| WESTERN AV | 10 |
| ALVARADO BL | 8 |
| ALVARADO BL | 8 |
| CABELLO ST | 8 |
| Other | 89 |
2002 - 2018 National Fire Incident Reporting System (NFIRS) incidents
- Incident types reported to NFIRS in Union City, CA
- 11,11672.9%Rescue & EMS
- 1,3859.1%Good Intent Call
- 1,0226.7%False Alarm
- 7404.9%Service Call
- 6914.5%Fire
- 2721.8%Hazardous Condition
- 160.1%Special Incident
- Fire incident types reported to NFIRS in Union City, CA
- 34049.2%Outside Fires
- 24535.5%Structure Fires
- 8512.3%Mobile Property/Vehicle Fires
- 213.0%Other
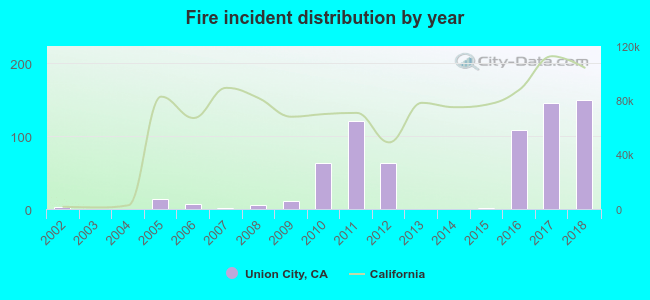 Based on the data from the years 2002 - 2018 the average number of fires per year is 41. The highest number of fire incidents - 149 took place in 2018, and the least - 0 in 2003. The data has a rising trend.
The average number of yearly fire incidents per 10k residents in Union City, CA compared to nearest cities:
(Note: Based on data for the last 3 years, including only cities with population 5,000 and above)
| Union City: | 18.2 |
| Hayward: | 3.3 |
| Newark: | 22.2 |
| Fremont: | 19.8 |
| San Lorenzo: | 27.3 |
| Castro Valley: | 14.8 |
| East Palo Alto: | 20.3 |
| San Leandro: | 33.1 |
| Pleasanton: | 20.6 |
 The median response time based on all reported fire incidents is 5 minutes. This is lower compared to the California median value.
The median response time in Union City, CA compared to nearest cities:
(Note: Based on data for all years, including only cities with at least 500 fire incidents)
| Union City: | 5 minutes |
| Hayward: | 4 minutes |
| Newark: | 4 minutes |
| Fremont: | 5 minutes |
| San Lorenzo: | 4 minutes |
| Castro Valley: | 5 minutes |
| East Palo Alto: | 4 minutes |
| San Leandro: | 4 minutes |
| Pleasanton: | 5 minutes |
 31.4% incidents where reported in the morning and 68.6% in the evening. The most fires (17.4%) took place on Friday, and the least (11.4%) on Saturday.
 According to the 691 fire incidents from years 2002 - 2018 most fires (20.5%) took place during July, and the least (4.1%) in November.
 Out of all 15,247 cases reported during the years 2002 - 2018, the most belonged to the categories: Rescue & EMS (72.9%), Good Intent Call (9.1%), and False Alarm (6.7%).
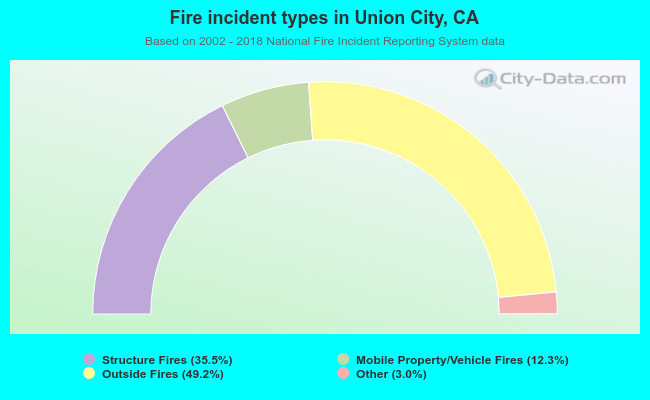 When looking into fire subcategories, the most incidents belonged to: Outside Fires (49.2%), and Structure Fires (35.5%).