Unionville: Fire Incidents, Missouri (MO)
Where are fire incidents reported in Unionville, MO
Something went wrong! Please refresh the page.
|
| |||||||||||||||||||||||||||||||||||||||||||||||||||||||||||||||||||||||||||||||||||||||||||||||||||||||||||||
| Other | 64 | |||||||||||||||||||||||||||||||||||||||||||||||||||||||||||||||||||||||||||||||||||||||||||||||||||||||||||||
2003 - 2018 National Fire Incident Reporting System (NFIRS) incidents
- Incident types reported to NFIRS in Unionville, MO
- 25865.5%Fire
- 5714.5%Rescue & EMS
- 338.4%Hazardous Condition
- 276.9%Good Intent Call
- 82.0%Severe Weather
- 71.8%Service Call
- 41.0%False Alarm
- Fire incident types reported to NFIRS in Unionville, MO
- 12146.9%Outside Fires
- 8231.8%Structure Fires
- 3915.1%Mobile Property/Vehicle Fires
- 166.2%Other
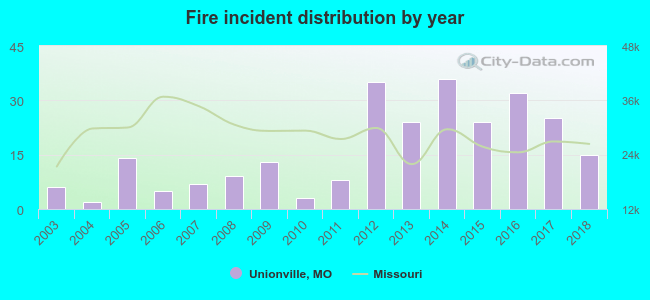 According to the data from the years 2003 - 2018 the average number of fire incidents per year is 16. The highest number of reported fire incidents - 36 took place in 2014, and the least - 2 in 2004. The data has an increasing trend.
 27.9% incidents where reported in the morning and 72.1% in the evening. The most fires (17.1%) took place on Tuesday, and the least (10.9%) on Sunday.
 Based on the 258 fires from years 2003 - 2018 most fires (17.4%) took place during March, and the least (3.1%) in December.
 Out of all 394 cases reported during the years 2003 - 2018, the most belonged to the categories: Fire (65.5%), Overpressure Rupture (14.5%), and Rescue & EMS (8.4%).
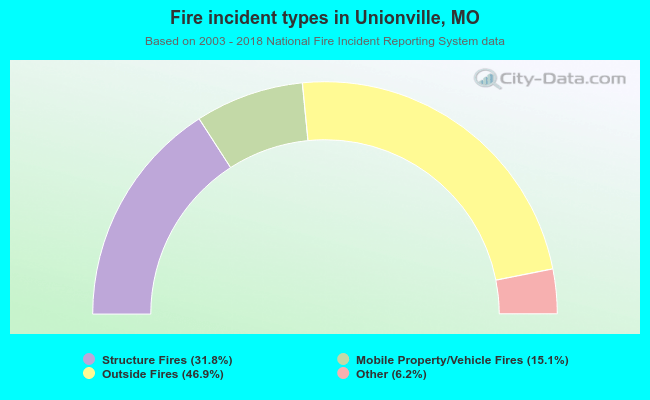 When looking into fire subcategories, the most incidents belonged to: Outside Fires (46.9%), and Structure Fires (31.8%).