| Fire incidents reported |
|---|
| Sreet name | Count |
|---|
| HWY 20 | 42 | | HIGHWAY 20 | 24 | | ELK MOUNTAIN RD | 14 | | ELK MTN RD | 12 | | 20 HWY | 10 | | BACHELOR VALLEY RD | 10 | | PITNEY LN | 10 | | STATE 20 HWY | 10 | | HWY 20 HWY | 8 | | RECLAMATION RD | 8 | | WESTLAKE RD | 8 | | BIG OAK WAY | 6 | | CLOVER VALLEY RD | 6 | | RANCHERIA RD | 6 | | SCOTTS VALLEY RD | 6 | | STATE HWY 20 HWY | 6 | | WHITE ROCK CANYON RD | 6 | | ACORN DR CIR | 4 | | BLUE LAKES RD | 4 | | CLOVER DR | 4 | | DIANE LN | 4 | | E S HWY 20 | 4 | | EAST RD | 4 | | GOVERNMENT ST | 4 | | HICKS TRAIL | 4 |
| | | Fire incidents reported |
|---|
| Sreet name | Count |
|---|
| LADDER RIDGE RD | 4 | | RANCHERIA RD | 4 | | SARATOGA SPRINGS RD | 4 | | SCOTTS VALLEY RD | 4 | | SODA COMPLEX | 4 | | STATE HIGHWAY 20 | 4 | | VAN SLEEPER | 4 | | WITTER SPRINGS RD | 4 | | 1205 W. STATE HWY 20 | 2 | | 12186 ELK MOUNTAIN RD | 2 | | 15 MILES EASTLAKE PILLSBURY | 2 | | 1ST STREET | 2 | | 29 HWY | 2 | | ACORN | 2 | | BACHELOR VALLEY RD | 2 | | BRIDGE ARBOR | 2 | | BRIDGE ARBOR NORTH | 2 | | BRIDGE ARBOR RD | 2 | | BRIDGE ARBOR X SPEER RD | 2 | | BRIDGE ARBOR/HWY 29 | 2 | | CA-MNF-645 SODA COM | 2 | | CLOVER VALLEY | 2 | | CLOVER VALLEY RD | 2 | | DEWELL RD EXTENSION | 2 | | |
|
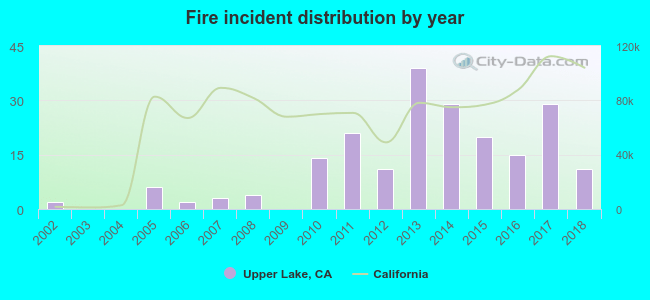 Based on the data from the years 2002 - 2018 the average number of fires per year is 12. The highest number of reported fires - 39 took place in 2013, and the least - 0 in 2003. The data has a growing trend.
 34.5% incidents where reported in the morning and 65.5% in the evening. The most fires (18.4%) took place on Friday, and the least (9.2%) on Monday.
 Based on the 206 fire incident reports from years 2002 - 2018 most fires (15.0%) took place during July, and the least (4.4%) in March.
 Out of all 1,569 cases reported during the years 2002 - 2018, the most belonged to the categories: Rescue & EMS (63.4%), Fire (13.1%), and Good Intent Call (11.6%).
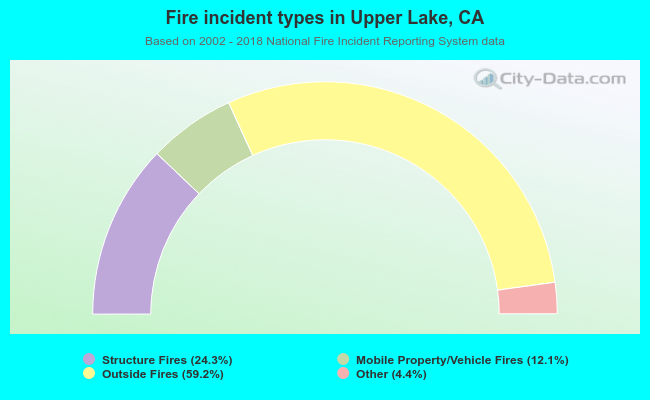 When looking into fire subcategories, the most incidents belonged to: Outside Fires (59.2%), and Structure Fires (24.3%).