| Fire incidents reported |
|---|
| Sreet name | Count |
|---|
| CR 316 | 6 | | 119 NORTH DALLAS | 4 | | 274 STATE ROAD BB | 4 | | 302 SOUTH DALLAS | 4 | | 54 MISSION RIDGE ROAD | 4 | | CROCUS STREET | 4 | | HIGH ST | 4 | | ROCKWOOD RD | 4 | | US HIGHWAY 65 | 4 | | 103 OSAGE RD | 2 | | 104 SOUTH HIGH | 2 | | 107 SKYVIEW RD. | 2 | | 111 THOMAS CREEK RD | 2 | | 112 S. HIGH | 2 | | 114 NORTH DALLAS | 2 | | 118 THOMAS CREEK ROAD | 2 | | 120 SOUTH HIGH | 2 | | 123 DIXIE RD. | 2 | | 1395 CO. RD. 316 | 2 | | 146 PROSPERITY RD | 2 | | 158 STATE RD D | 2 | | 17 DAIRY LN. | 2 | | 180 ROUNTREE ROAD | 2 | | 19 HOWARD CHAPEL ROAD | 2 | | 199 ROCKWOOD RD | 2 |
| | | Fire incidents reported |
|---|
| Sreet name | Count |
|---|
| 205 OTTERBERTRY | 2 | | 2110 COUNTY ROAD 397 | 2 | | 223 ST. U HWY | 2 | | 233 HOWARD CHAPEL RD | 2 | | 24220 COUNTY ROAD 302 | 2 | | 25730 SWAN LANE | 2 | | 26273 EAGLE PLACE | 2 | | 2665 US HIGHWAY 65 | 2 | | 273 SIMPSON RD. | 2 | | 2753 HWY 65 | 2 | | 285 STATE RD U | 2 | | 2869 US HIGHWAY 65 | 2 | | 2876 US HIGHWAY 65 | 2 | | 29071 C R 316 | 2 | | 2920 US HWY 65 | 2 | | 302 WALNUT ST | 2 | | 302 WALNUT STREET | 2 | | 306 N. MAIN ST. | 2 | | 306 NORTH MAIN | 2 | | 309 WEST BROADWAY | 2 | | 3156 US HIGHWAY 65 | 2 | | 3156 US HWY 65 | 2 | | 316 2 MILES | 2 | | 32 DRY BRANCH TRAIL | 2 | | |
|
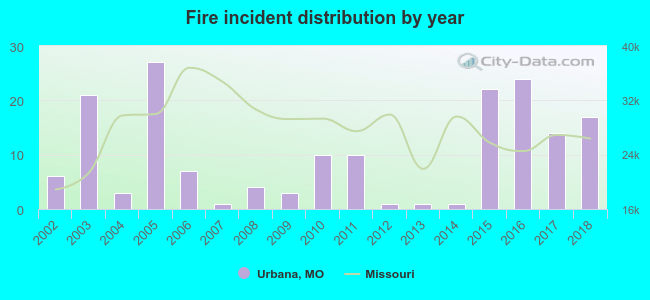 According to the data from the years 2002 - 2018 the average number of fire incidents per year is 10. The highest number of reported fire incidents - 27 took place in 2005, and the least - 1 in 2007. The data has an increasing trend.
 24.4% incidents where reported in the morning and 75.6% in the evening. The most fires (19.8%) took place on Friday, and the least (10.5%) on Tuesday.
 Based on the 172 fires from years 2002 - 2018 most fires (22.7%) took place during March, and the least (2.9%) in June.
 Out of all 821 cases reported during the years 2002 - 2018, the most belonged to the categories: Rescue & EMS (64.1%), Fire (21.0%), and Good Intent Call (5.4%).
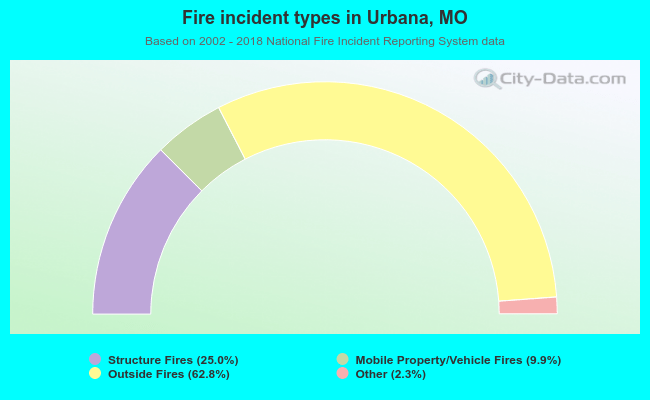 When looking into fire subcategories, the most incidents belonged to: Outside Fires (62.8%), and Structure Fires (25.0%).