| Fire incidents reported |
|---|
| Sreet name | Count |
|---|
| DEAD RIVER RD | 38 | | GIBBS BRIDGE RD | 26 | | PEGGY ST | 18 | | 221 SOUTH HWY | 14 | | ADAMS RD | 12 | | CHARLETTEVILLE RD | 12 | | HWY 221 | 12 | | OLD RIVER RD. | 12 | | THREE RIVERS LN | 12 | | BELLS FERRY RD | 10 | | CURRIE RD | 10 | | GREEN THIGPEN RD | 10 | | RED HILL RD | 10 | | 221 NORTH HWY | 8 | | BROWN ST | 8 | | CHARLOTTEVILLE RD | 8 | | HWY 221 N | 8 | | OLD RIVER RD | 8 | | TOOLE RD | 8 | | BEULAH ST | 6 | | CONNER RD | 6 | | DEAD RIVER RD. | 6 | | THREE RIVERS LANE LN | 6 | | TURNER CREEK RD | 6 | | WEST MAIN ST | 6 |
| | | Fire incidents reported |
|---|
| Sreet name | Count |
|---|
| 221 S HWY | 4 | | ALSTON LONGPOND RD | 4 | | BELLS FERRY | 4 | | CHARLETTEVILLE RD. | 4 | | CONNOR RD | 4 | | GA HWY 135 HWY | 4 | | HARBIN RD | 4 | | HWY 135 | 4 | | HWY 221 S | 4 | | LONG PONDUVALDA | 4 | | MCNATT FALLS RD | 4 | | N OLD RIVER RD | 4 | | OAK ST | 4 | | ROBINSON LN | 4 | | S FIRST ST | 4 | | SOUTH OLD RIVER RD | 4 | | TURNER BRIDGE RD | 4 | | WARREN ST | 4 | | WOOTEN LN | 4 | | 1114 DEAD RIVER ROAD | 2 | | 135 HWY | 2 | | 221 HWY | 2 | | 221 N HWY | 2 | | 221 S | 2 | | 334 BEULAH STREET | 2 |
|
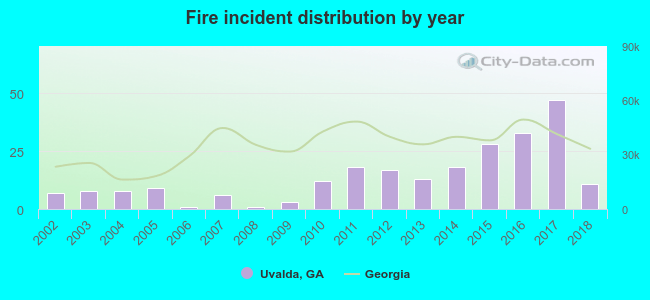 Based on the data from the years 2002 - 2018 the average number of fire incidents per year is 14. The highest number of fires - 47 took place in 2017, and the least - 1 in 2006. The data has an increasing trend.
 29.2% incidents where reported in the morning and 70.8% in the evening. The most fires (17.5%) took place on Wednesday, and the least (9.2%) on Saturday.
 Based on the 240 incident reports from years 2002 - 2018 most fires (16.7%) took place during March, and the least (2.9%) in June.
 Out of all 365 cases reported during the years 2002 - 2018, the most belonged to the categories: Fire (65.8%), Overpressure Rupture (17.0%), and Service Call (8.8%).
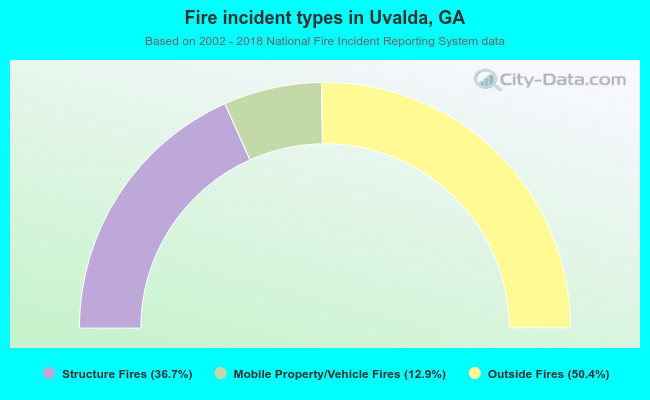 When looking into fire subcategories, the most incidents belonged to: Outside Fires (50.4%), and Structure Fires (36.7%).