Valley View: Fire Incidents, Ohio (OH)
Where are fire incidents reported in Valley View, OH
Something went wrong! Please refresh the page.
|
| |||||||||||||||||||||||||||||||||||||||||||||||||||||||||||||||||||||||||||||||||||||||||||||||||||||||||||||
2002 - 2018 National Fire Incident Reporting System (NFIRS) incidents
- Incident types reported to NFIRS in Valley View, OH
- 97538.8%Rescue & EMS
- 50620.1%Hazardous Condition
- 33813.4%False Alarm
- 28911.5%Fire
- 2078.2%Service Call
- 1797.1%Good Intent Call
- 90.4%Severe Weather
- 80.3%Overpressure Rupture
- 50.2%Special Incident
- Fire incident types reported to NFIRS in Valley View, OH
- 13847.8%Outside Fires
- 9532.9%Structure Fires
- 5218.0%Mobile Property/Vehicle Fires
- 41.4%Other
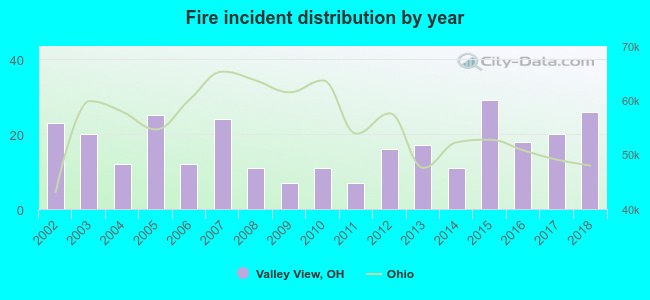 Based on the data from the years 2002 - 2018 the average number of fires per year is 17. The highest number of reported fires - 29 took place in 2015, and the least - 7 in 2009. The data has an increasing trend.
 32.9% incidents where reported in the morning and 67.1% in the evening. The most fires (19.4%) took place on Friday, and the least (10.0%) on Saturday.
 Based on the 289 reports from years 2002 - 2018 most fires (15.2%) took place during May, and the least (3.8%) in December.
 Out of all 2,516 cases reported during the years 2002 - 2018, the most belonged to the categories: Rescue & EMS (38.8%), Hazardous Condition (20.1%), and False Alarm (13.4%).
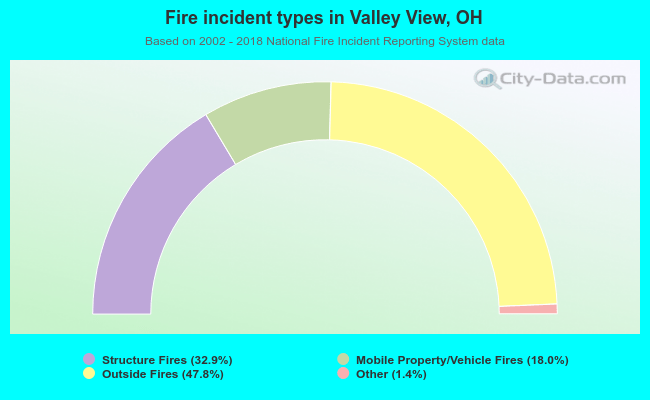 When looking into fire subcategories, the most reports belonged to: Outside Fires (47.8%), and Structure Fires (32.9%).