Van Buren: Fire Incidents, Indiana (IN)
Where are fire incidents reported in Van Buren, IN
Something went wrong! Please refresh the page.
|
| |||||||||||||||||||||||||||||||||||||||||||||||||||||||||||||||||||||||||||||||||||||||||||||||||||||||||||||
2002 - 2018 National Fire Incident Reporting System (NFIRS) incidents
- Incident types reported to NFIRS in Van Buren, IN
- 16461.2%Fire
- 3613.4%Hazardous Condition
- 269.7%Good Intent Call
- 217.8%Rescue & EMS
- 93.4%False Alarm
- 62.2%Service Call
- 31.1%Severe Weather
- 20.7%Special Incident
- 10.4%Overpressure Rupture
- Fire incident types reported to NFIRS in Van Buren, IN
- 8350.6%Structure Fires
- 5432.9%Outside Fires
- 159.1%Mobile Property/Vehicle Fires
- 127.3%Other
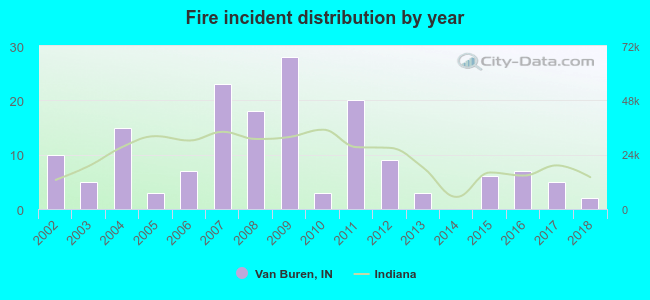 Based on the data from the years 2002 - 2018 the average number of fires per year is 10. The highest number of fires - 28 took place in 2009, and the least - 0 in 2014. The data has a dropping trend.
 27.4% incidents where reported in the morning and 72.6% in the evening. The most fires (16.5%) took place on Monday, and the least (11.6%) on Wednesday.
 Based on the 164 incident reports from years 2002 - 2018 most fires (14.6%) took place during January, and the least (2.4%) in September.
 Out of all 268 cases reported during the years 2002 - 2018, the most belonged to the categories: Fire (61.2%), Hazardous Condition (13.4%), and Good Intent Call (9.7%).
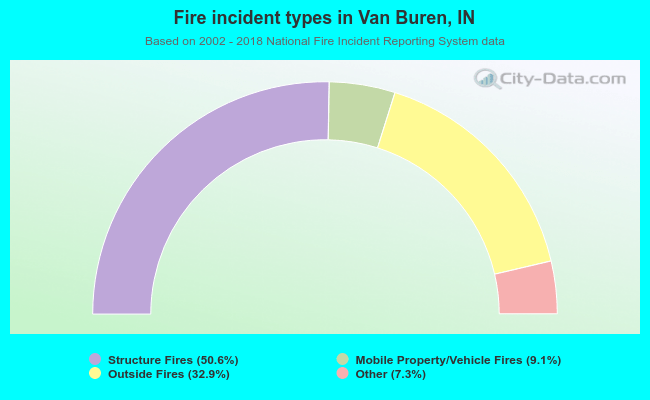 When looking into fire subcategories, the most incidents belonged to: Structure Fires (50.6%), and Outside Fires (32.9%).