Vienna: Fire Incidents, West Virginia (WV)
Where are fire incidents reported in Vienna, WV
Something went wrong! Please refresh the page.
|
| |||||||||||||||||||||||||||||||||||||||||||||||||||||||||||||||||||||||||||||||||||||||||||||||||||||||||||||
2003 - 2018 National Fire Incident Reporting System (NFIRS) incidents
- Incident types reported to NFIRS in Vienna, WV
- 77831.2%Hazardous Condition
- 44317.8%Fire
- 42417.0%Good Intent Call
- 34914.0%False Alarm
- 33213.3%Service Call
- 1576.3%Rescue & EMS
- 70.3%Severe Weather
- Fire incident types reported to NFIRS in Vienna, WV
- 22250.1%Structure Fires
- 14833.4%Outside Fires
- 6715.1%Mobile Property/Vehicle Fires
- 61.4%Other
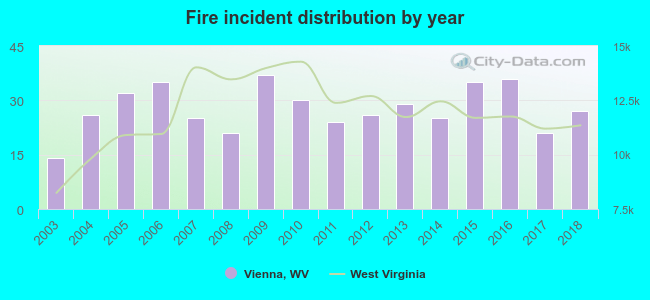 Based on the data from the years 2003 - 2018 the average number of fires per year is 28. The highest number of reported fires - 37 took place in 2009, and the least - 14 in 2003. The data has a growing trend.
The average number of yearly fire incidents per 10k residents in Vienna, WV compared to nearest cities:
(Note: Based on data for the last 3 years, including only cities with population 5,000 and above)
| Vienna: | 26.5 |
| Parkersburg: | 67.1 |
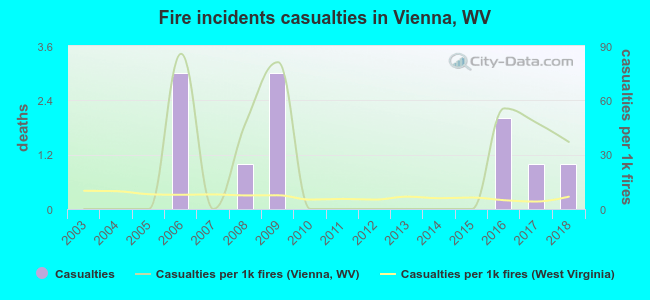 According to the reports from the years 2003 - 2018 the average number of fire-related casualties per year is 1. The highest number of casualties - 3 took place in 2006, and the lowest - 0 in 2003. The data has an increasing trend.
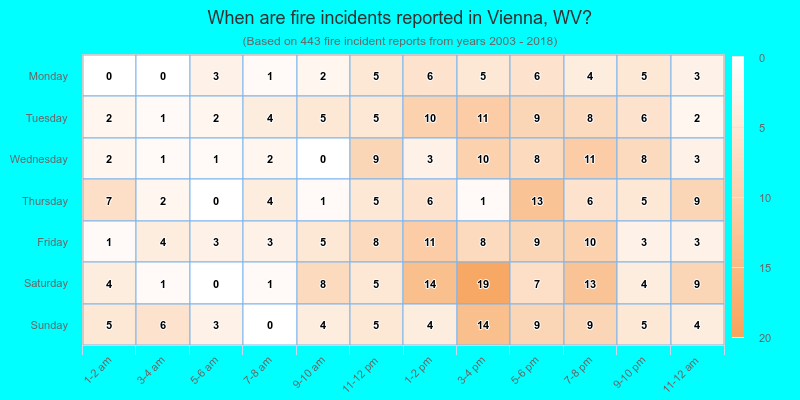
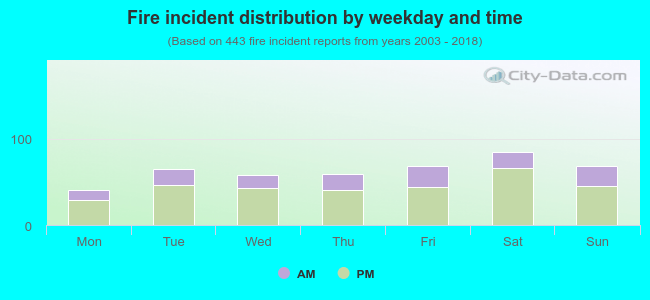 29.3% incidents where reported in the morning and 70.7% in the evening. The most fires (19.2%) took place on Saturday, and the least (9.0%) on Monday.
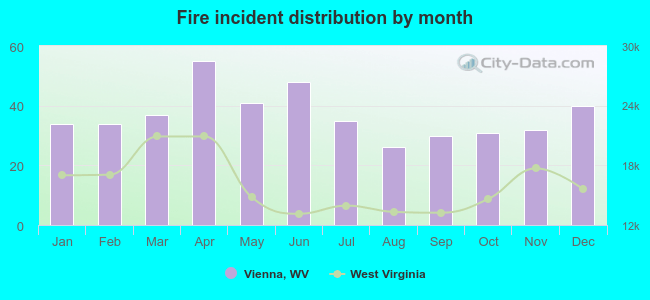 According to the 443 fire incidents from years 2003 - 2018 most fires (12.4%) took place during April, and the least (5.9%) in August.
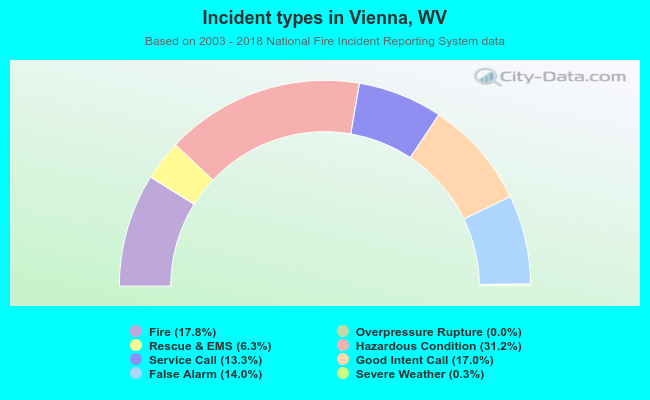 Out of all 2,491 cases reported during the years 2003 - 2018, the most belonged to the categories: Hazardous Condition (31.2%), Fire (17.8%), and Good Intent Call (17.0%).
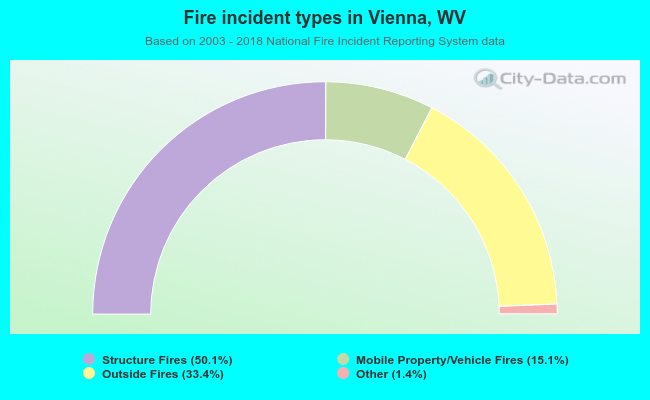 When looking into fire subcategories, the most reports belonged to: Structure Fires (50.1%), and Outside Fires (33.4%).