| Fire incidents reported |
|---|
| Sreet name | Count |
|---|
| STATE ROUTE 339 | 16 | | ST RT 339 HWY | 12 | | STATE ROUTE 550 BARLOW | 12 | | ST RT 550 HWY | 10 | | TICK RIDGE RD. | 10 | | ROCKY POINT RD RD | 8 | | STATE ROUTE 550 , | 8 | | RODDY RD | 6 | | VETO ROAD RD | 6 | | BARRETT-SOUTH RD. | 4 | | BELL RD RD | 4 | | BELL ROAD | 4 | | CO RD 805 - SWEETAPPLE RD | 4 | | COUNTY RD 30 | 4 | | LAKEVIEW DR. | 4 | | MOODY RIDGE ROAD RD | 4 | | ROCKY POINT RD. RD | 4 | | SEALEY RIDGE ROAD RD | 4 | | SEALY RIDGE RD TWP 244 RD | 4 | | SPRINGSTON ROAD RD | 4 | | SPRINGSTON ROAD TWP 113 RD | 4 | | ST RT 339 | 4 | | STATE ROUTE 339 RT | 4 | | STATE ROUTE 550 | 4 | | TICK RIDGE RD | 4 |
| | | Fire incidents reported |
|---|
| Sreet name | Count |
|---|
| TICK RIDGE RD RD | 4 | | TWP 17 - TICKRIDGE | 4 | | TWP 261-DEMING RD. | 4 | | VETO RD | 4 | | WALASH RD | 4 | | WINDY RIDGE ROAD | 4 | | 14320 SR 339 | 2 | | 2342 SEALY RIDGE ROAD | 2 | | 2595 WOODRUFF RD. | 2 | | 499 MCGILL ROAD | 2 | | ANDERSON RD-COUNTY ROAD 2 | 2 | | BARNETT RIDGE RD. | 2 | | BARRETT SOUTH RD RD | 2 | | BARRETTSOUTH RD | 2 | | BRACKENRIDGE ROAD | 2 | | BROWNRIGG RD | 2 | | BROWNRIGG RD CO RD 6 | 2 | | BURNETT RD | 2 | | BURNFIELD RD | 2 | | BURNFIELD RD | 2 | | BURNFIELD ROAD TWP 293 RD | 2 | | CO RD. 2 BARNETT RIDGE | 2 | | COUNTY ROAD 2 RD | 2 | | DARNOLD RD | 2 | | |
|
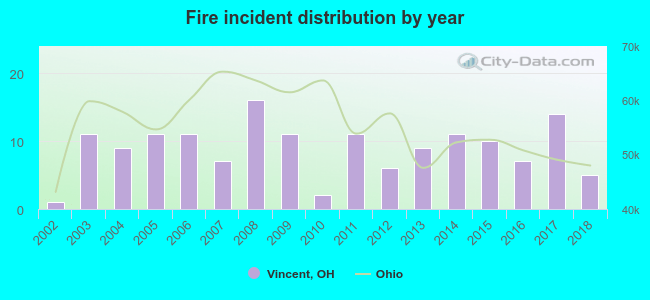 Based on the data from the years 2002 - 2018 the average number of fire incidents per year is 9. The highest number of fires - 16 took place in 2008, and the least - 1 in 2002. The data has a rising trend.
 34.9% incidents where reported in the morning and 65.1% in the evening. The most fires (17.1%) took place on Monday, and the least (11.8%) on Thursday.
 According to the 152 fires from years 2002 - 2018 most fires (16.4%) took place during December, and the least (3.9%) in August.
 Out of all 465 cases reported during the years 2002 - 2018, the most belonged to the categories: Fire (32.7%), Hazardous Condition (31.4%), and Rescue & EMS (18.3%).
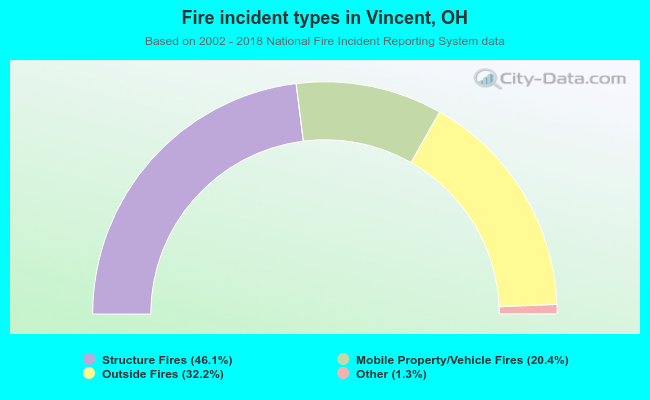 When looking into fire subcategories, the most reports belonged to: Structure Fires (46.1%), and Outside Fires (32.2%).