Wabbaseka: Fire Incidents, Arkansas (AR)
Where are fire incidents reported in Wabbaseka, AR
Something went wrong! Please refresh the page.
|
| |||||||||||||||||||||||||||||||||||||||||||||||||||||||||||||||||||||||||||||||||||||||||||||||||||||||||||||
2004 - 2018 National Fire Incident Reporting System (NFIRS) incidents
- Incident types reported to NFIRS in Wabbaseka, AR
- 17186.4%Fire
- 126.1%Good Intent Call
- 63.0%Hazardous Condition
- 52.5%Rescue & EMS
- 21.0%Service Call
- 10.5%Overpressure Rupture
- 10.5%False Alarm
- Fire incident types reported to NFIRS in Wabbaseka, AR
- 8449.1%Structure Fires
- 7242.1%Outside Fires
- 148.2%Mobile Property/Vehicle Fires
- 10.6%Other
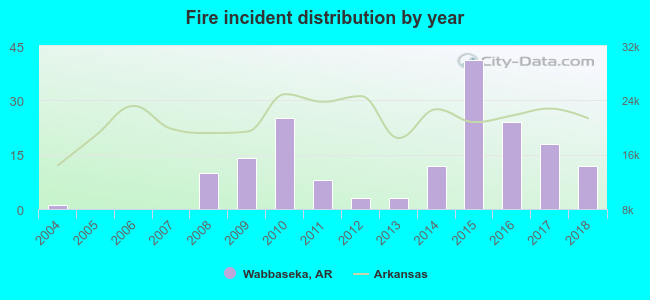 Based on the data from the years 2004 - 2018 the average number of fires per year is 11. The highest number of fire incidents - 41 took place in 2015, and the least - 0 in 2005. The data has an increasing trend.
 23.4% incidents where reported in the morning and 76.6% in the evening. The most fires (18.7%) took place on Thursday, and the least (11.1%) on Sunday.
 According to the 171 fire incident reports from years 2004 - 2018 most fires (20.5%) took place during August, and the least (2.3%) in November.
 Out of all 198 cases reported during the years 2004 - 2018, the most belonged to the categories: Fire (86.4%), Good Intent Call (6.1%), and Hazardous Condition (3.0%).
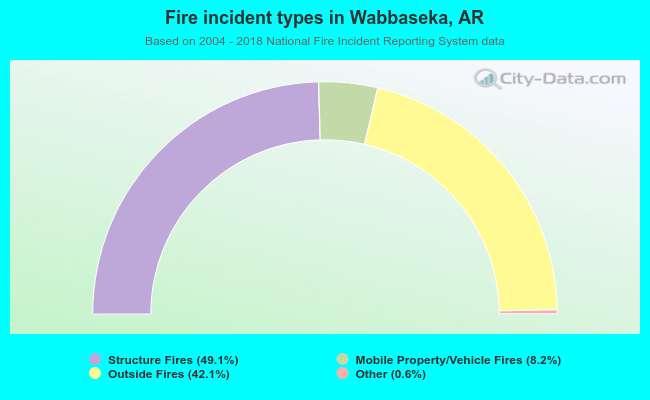 When looking into fire subcategories, the most incidents belonged to: Structure Fires (49.1%), and Outside Fires (42.1%).